

Question: USING MATLAB PLEASE SHOW CODE An investigator has reported the data tabulated below for an experiment to determine the growth rate of bacteria k (per
USING MATLAB PLEASE SHOW CODE
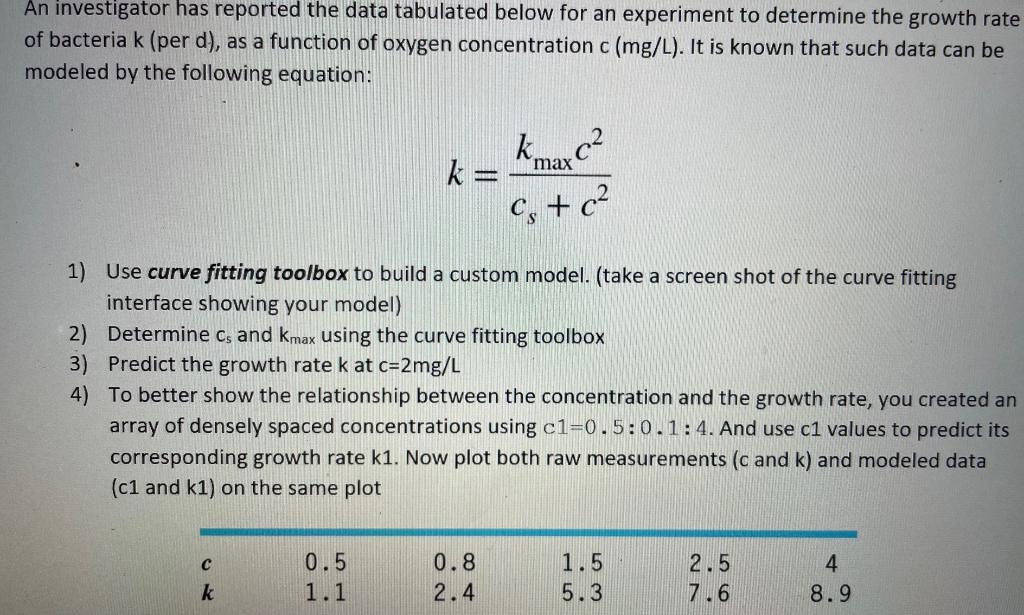
An investigator has reported the data tabulated below for an experiment to determine the growth rate of bacteria k (per d ), as a function of oxygen concentration c ( mg/L ). It is known that such data can be modeled by the following equation: k=cs+c2kmaxc2 1) Use curve fitting toolbox to build a custom model. (take a screen shot of the curve fitting interface showing your model) 2) Determine cs and kmax using the curve fitting toolbox 3) Predict the growth rate k at c=2mg/L 4) To better show the relationship between the concentration and the growth rate, you created an array of densely spaced concentrations using c1=0.5:0.1:4. And use c1 values to predict its corresponding growth rate k1. Now plot both raw measurements ( c and k ) and modeled data ( c and k1 ) on the same plot
Step by Step Solution
There are 3 Steps involved in it

Get step-by-step solutions from verified subject matter experts