

Question: USING MATLAB!! USING MATLAB!! 1. For the data given in the table 1 below: x 5 10152025 3035 40 4550 y 17243133 373740 40 441
USING MATLAB!!
USING MATLAB!!
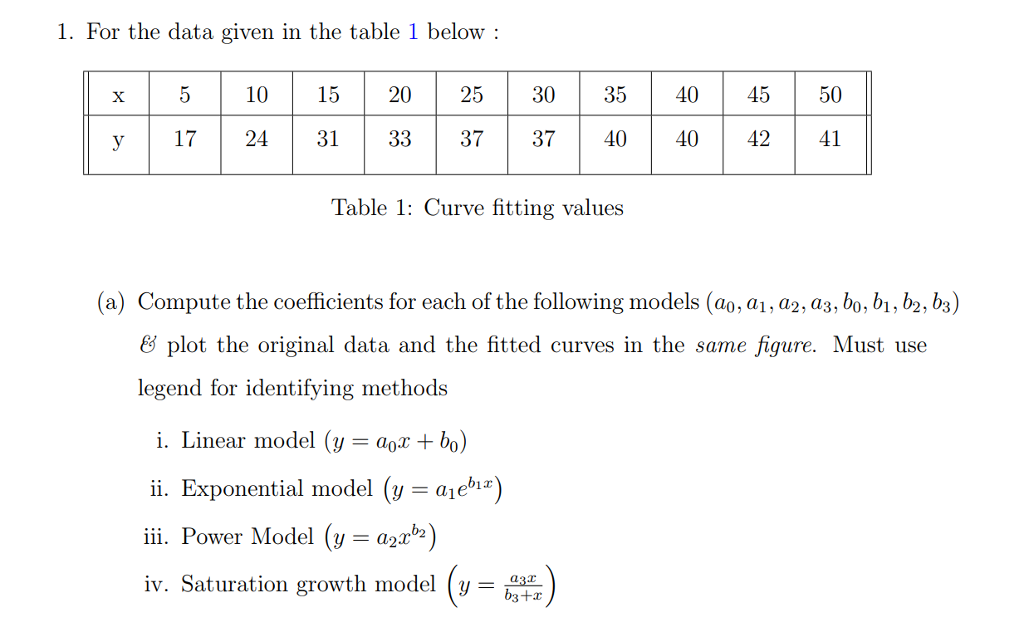
1. For the data given in the table 1 below: x 5 10152025 3035 40 4550 y 17243133 373740 40 441 Table 1: Curve fitting values (a) Compute the coefficients for each of the following models (ao, ai , a2, ??, bo, b, b, bs) & plot the original data and the fitted curves in the same figure. Must use legend for identifying methods i. Linear model (y = aox + bo) ii. Exponential model (y = aichz iii. Power Model (y -a2r02 IV. Saturation growth model 2/- u3t (y = )
Step by Step Solution
There are 3 Steps involved in it
1 Expert Approved Answer
Step: 1 Unlock

Question Has Been Solved by an Expert!
Get step-by-step solutions from verified subject matter experts
Step: 2 Unlock
Step: 3 Unlock