

Question: Using python and simple graphics library For this assignment you will create a program that will use the Simple Graphics library to draw a chart
Using python and simple graphics library
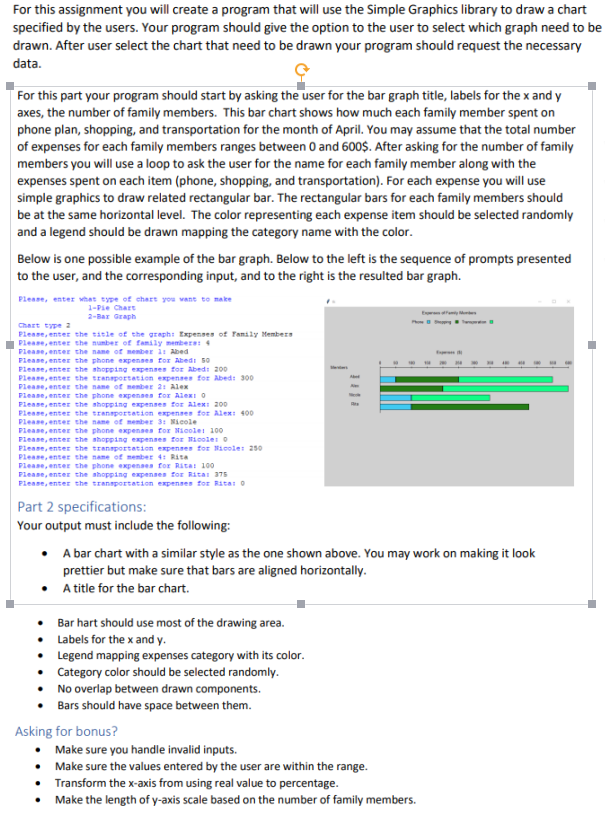
For this assignment you will create a program that will use the Simple Graphics library to draw a chart specified by the users. Your program should give the option to the user to select which graph need to be drawn. After user select the chart that need to be drawn your program should request the necessary data. For this part your program should start by asking the user for the bar graph title, labels for the xand y axes, the number of family members. This bar chart shows how much each family member spent on phone plan, shopping, and transportation for the month of April. You may assume that the total number of expenses for each family members ranges between 0 and 600$. After asking for the number of family members you will use a loop to ask the user for the name for each family member along with the expenses spent on each item (phone, shopping, and transportation). For each expense you will use simple graphics to draw related rectangular bar. The rectangular bars for each family members should be at the same horizontal level. The color representing each expense item should be selected randomly and a legend should be drawn mapping the category name with the color Below is one possible example of the bar graph. Below to the left is the sequence of prompts presented to the user, and the corresponding input, and to the right is the resulted bar graph. lease enter what sype of chaEt y wane tO make 2-Bar Graph Chart se 2 lease,enter the sscle of the graph: Expenses of Tanaly Members PLeaseener the nunber of tanily membess Please,enter the nane of meber Abed Please, enser the phone expemses for Abedi leaseenter the shopping expenses tor Abeds 200 Please, enter the sranaporsation expenses for Abed: 300 Please,entee the nane of meber 2: Alex Please,enser the phone expemses foT AIeI leaseenser the shopoing expenses or Alex: 200 Please,enter the srenaportation expenses for ALex: 400 Please,encee the nane of member 3 Nieole please, enter the phone expenses to Nicole! 100 lease,encer the shopping expenses ox ooler Please,enter the srenaporsation expenses foracole: 250 Please,enter the name of member 4: Rita Please,enter the phone expenses for RitHE 100 Please, enser the shopping expenses for Ria: 37 leaseenter the srsnaporcation expenses for RAtAS Part 2 specifications Your output must include the following: A bar chart with a similar style as the one shown above. You may work on making it look prettier but make sure that bars are aligned horizontally A title for the bar chart. Bar hart should use most of the drawing area. Labels for the x and y Legend mapping expenses category with its color Category color should be selected randomly No overlap between drawn components. Bars should have space between them Asking for bonus? Make sure you handle invalid inputs. Make sure the values entered by the user are within the range Transform the x-axis from using real value to percentage Make the length of y-axis scale based on the number of family members. For this assignment you will create a program that will use the Simple Graphics library to draw a chart specified by the users. Your program should give the option to the user to select which graph need to be drawn. After user select the chart that need to be drawn your program should request the necessary data. For this part your program should start by asking the user for the bar graph title, labels for the xand y axes, the number of family members. This bar chart shows how much each family member spent on phone plan, shopping, and transportation for the month of April. You may assume that the total number of expenses for each family members ranges between 0 and 600$. After asking for the number of family members you will use a loop to ask the user for the name for each family member along with the expenses spent on each item (phone, shopping, and transportation). For each expense you will use simple graphics to draw related rectangular bar. The rectangular bars for each family members should be at the same horizontal level. The color representing each expense item should be selected randomly and a legend should be drawn mapping the category name with the color Below is one possible example of the bar graph. Below to the left is the sequence of prompts presented to the user, and the corresponding input, and to the right is the resulted bar graph. lease enter what sype of chaEt y wane tO make 2-Bar Graph Chart se 2 lease,enter the sscle of the graph: Expenses of Tanaly Members PLeaseener the nunber of tanily membess Please,enter the nane of meber Abed Please, enser the phone expemses for Abedi leaseenter the shopping expenses tor Abeds 200 Please, enter the sranaporsation expenses for Abed: 300 Please,entee the nane of meber 2: Alex Please,enser the phone expemses foT AIeI leaseenser the shopoing expenses or Alex: 200 Please,enter the srenaportation expenses for ALex: 400 Please,encee the nane of member 3 Nieole please, enter the phone expenses to Nicole! 100 lease,encer the shopping expenses ox ooler Please,enter the srenaporsation expenses foracole: 250 Please,enter the name of member 4: Rita Please,enter the phone expenses for RitHE 100 Please, enser the shopping expenses for Ria: 37 leaseenter the srsnaporcation expenses for RAtAS Part 2 specifications Your output must include the following: A bar chart with a similar style as the one shown above. You may work on making it look prettier but make sure that bars are aligned horizontally A title for the bar chart. Bar hart should use most of the drawing area. Labels for the x and y Legend mapping expenses category with its color Category color should be selected randomly No overlap between drawn components. Bars should have space between them Asking for bonus? Make sure you handle invalid inputs. Make sure the values entered by the user are within the range Transform the x-axis from using real value to percentage Make the length of y-axis scale based on the number of family members
Step by Step Solution
There are 3 Steps involved in it

Get step-by-step solutions from verified subject matter experts