

Question: Using python and simple graphics library For this assignment you will create a program that will use the Simple Graphics library to draw a chart
Using python and simple graphics library
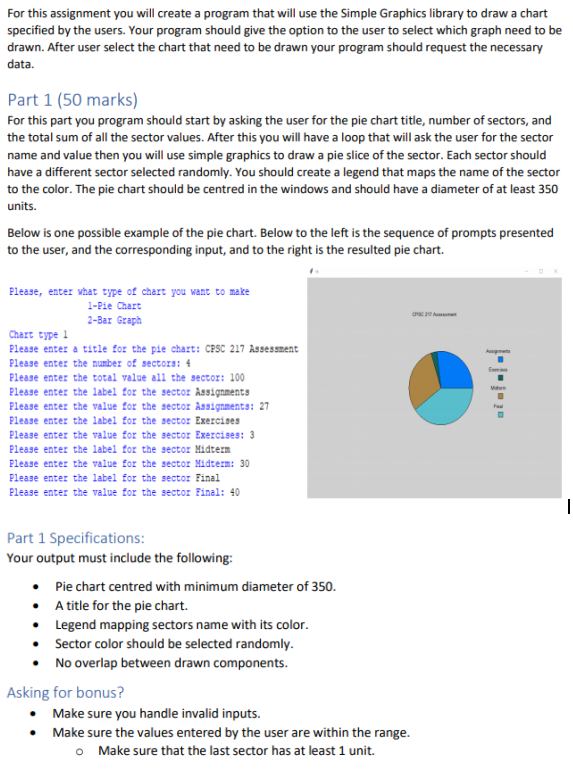
For this assignment you will create a program that will use the Simple Graphics library to draw a chart specified by the users. Your program should give the option to the user to select which graph need to be drawn. After user select the chart that need to be drawn your program should request the necessary data. Part 1 (50 marks) For this part you program should start by asking the user for the pie chart title, number of sectors, and the total sum of all the sector values. After this you will have a loop that will ask the user for the sector name and value then you will use simple graphics to draw a pie slice of the sector. Each sector should have a different sector selected randomly. You should create a legend that maps the name of the sector to the color. The pie chart should be centred in the windows and should have a diameter of at least 350 units. Below is one possible example of the pie chart. Below to the left is the sequence of prompts presented to the user, and the corresponding input, and to the right is the resulted pie chart. Please, enter what type of chart you want to make l-Pie Chart 2-Bar Graph Chart type 1 Please enter a title for the pie chart: CFSC 217 Assessnent Please enter the nunber of sectors: Please enter the total value all the sector: 100 Please enter the label for the sector Assignments Please entez the value for the sector Assignments: 27 Please enter the label for the sector Exercises Please enter the value for the sector Exercises: 3 Please enter the label for the sectoz Midter Please enter the value for the ?ector Midterm: 30 Please enter the label for the sector Final Please enter the value for the sector Final: 40 Part 1 Specification:s Your output must include the following Pie chart centred with minimum diameter of 350. A title for the pie chart. Legend mapping sectors name with its color Sector color should be selected randomly No overlap between drawn components Asking for bonus? Make sure you handle invalid inputs. Make sure the values entered by the user are within the range o Make sure that the last sector has at least 1 unit. For this assignment you will create a program that will use the Simple Graphics library to draw a chart specified by the users. Your program should give the option to the user to select which graph need to be drawn. After user select the chart that need to be drawn your program should request the necessary data. Part 1 (50 marks) For this part you program should start by asking the user for the pie chart title, number of sectors, and the total sum of all the sector values. After this you will have a loop that will ask the user for the sector name and value then you will use simple graphics to draw a pie slice of the sector. Each sector should have a different sector selected randomly. You should create a legend that maps the name of the sector to the color. The pie chart should be centred in the windows and should have a diameter of at least 350 units. Below is one possible example of the pie chart. Below to the left is the sequence of prompts presented to the user, and the corresponding input, and to the right is the resulted pie chart. Please, enter what type of chart you want to make l-Pie Chart 2-Bar Graph Chart type 1 Please enter a title for the pie chart: CFSC 217 Assessnent Please enter the nunber of sectors: Please enter the total value all the sector: 100 Please enter the label for the sector Assignments Please entez the value for the sector Assignments: 27 Please enter the label for the sector Exercises Please enter the value for the sector Exercises: 3 Please enter the label for the sectoz Midter Please enter the value for the ?ector Midterm: 30 Please enter the label for the sector Final Please enter the value for the sector Final: 40 Part 1 Specification:s Your output must include the following Pie chart centred with minimum diameter of 350. A title for the pie chart. Legend mapping sectors name with its color Sector color should be selected randomly No overlap between drawn components Asking for bonus? Make sure you handle invalid inputs. Make sure the values entered by the user are within the range o Make sure that the last sector has at least 1 unit
Step by Step Solution
There are 3 Steps involved in it

Get step-by-step solutions from verified subject matter experts