

Question: using python Question 1: Population Lines A) 2010 Use pandas to read a dataframe from the file census_18.csv . Then produce a line plot of
using python
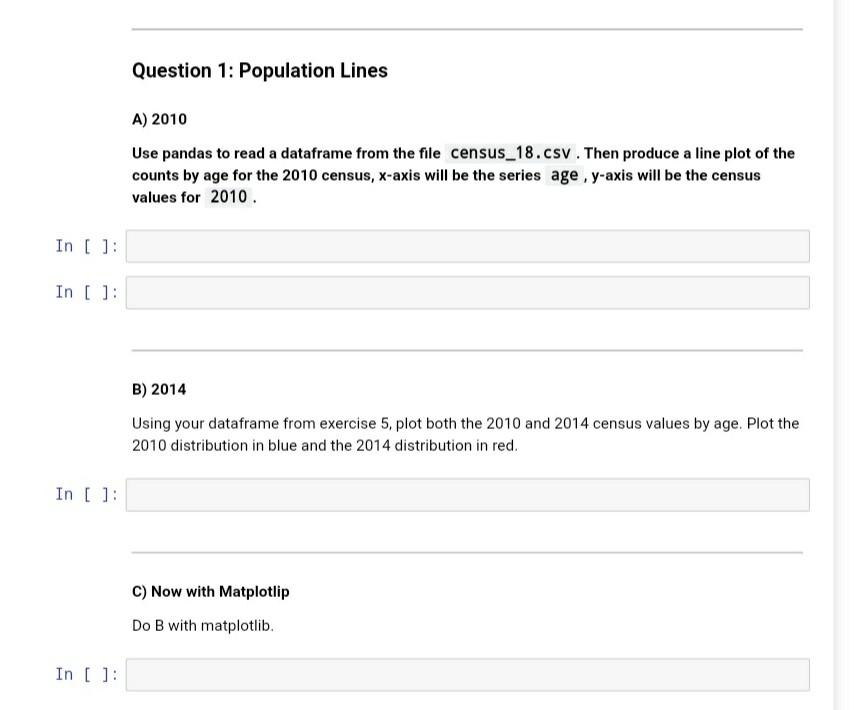
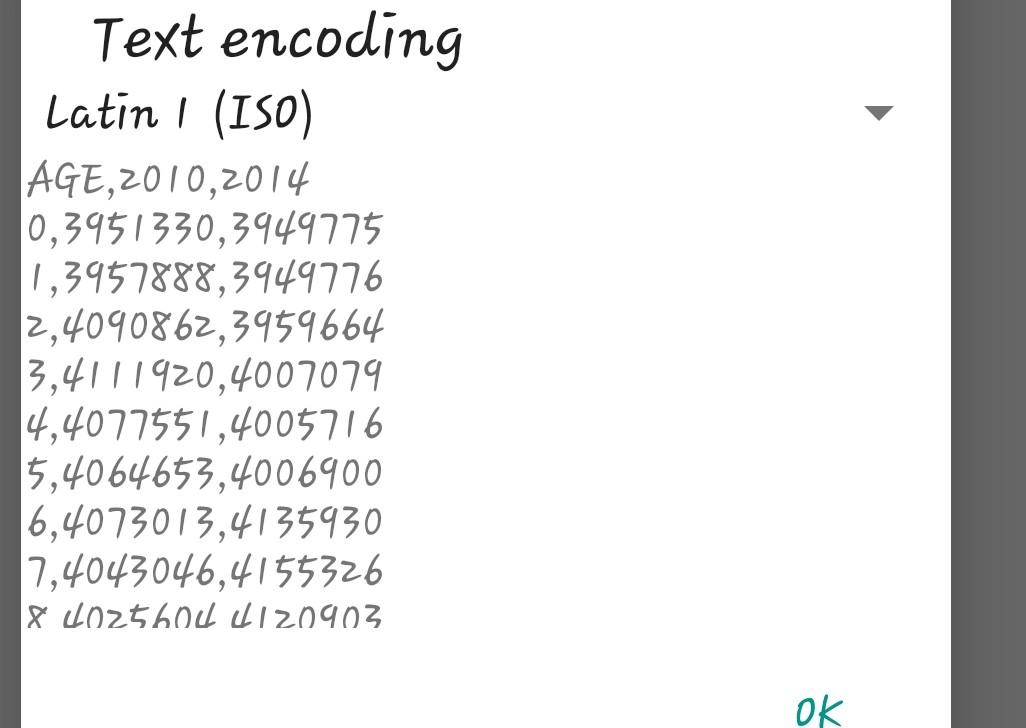
Question 1: Population Lines A) 2010 Use pandas to read a dataframe from the file census_18.csv . Then produce a line plot of the counts by age for the 2010 census, x-axis will be the series age , y-axis will be the census values for 2010 In [ ]: In [ ]: B) 2014 Using your dataframe from exercise 5. plot both the 2010 and 2014 census values by age. Plot the 2010 distribution in blue and the 2014 distribution in red. In [ ]: C) Now with Matplotlip Do B with matplotlib. In [ ]: Text encoding Latin 1 (ISO) AGE,2010,2014 10,3951330,3949775 1,3957888,3949776 2,4090862,3959664 3,4111920,4007079 4,4077551,4005716 5,4064653,4006900 6,4073013,4135930 7,4043046,4155326 18 402560c d120903 ok Question 1: Population Lines A) 2010 Use pandas to read a dataframe from the file census_18.csv . Then produce a line plot of the counts by age for the 2010 census, x-axis will be the series age , y-axis will be the census values for 2010 In [ ]: In [ ]: B) 2014 Using your dataframe from exercise 5. plot both the 2010 and 2014 census values by age. Plot the 2010 distribution in blue and the 2014 distribution in red. In [ ]: C) Now with Matplotlip Do B with matplotlib. In [ ]: Text encoding Latin 1 (ISO) AGE,2010,2014 10,3951330,3949775 1,3957888,3949776 2,4090862,3959664 3,4111920,4007079 4,4077551,4005716 5,4064653,4006900 6,4073013,4135930 7,4043046,4155326 18 402560c d120903 ok
Step by Step Solution
There are 3 Steps involved in it

Get step-by-step solutions from verified subject matter experts