

Question: Using Python3 to solve For this part your program should start by asking the user for the bar graph title, labels for the x and
Using Python3 to solve
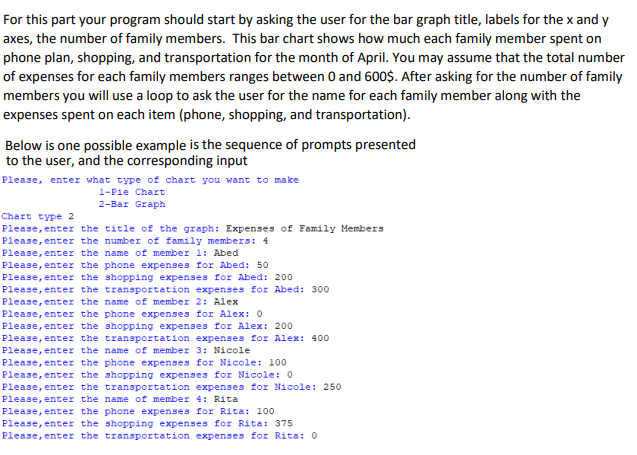
For this part your program should start by asking the user for the bar graph title, labels for the x and y axes, the number of family members. This bar chart shows how much each family member spent on phone plan, shopping, and transportation for the month of April. You may assume that the total number of expenses for each family members ranges between 0 and 600$. After asking for the number of family members you will use a loop to ask the user for the name for each family member along with the expenses spent on each item (phone, shopping, and transportation) Below is one possible example is the sequence of prompts presented to the user, and the corresponding input Please, enter what type of chart you want to make 1-Pie Chart 2-Bar Graph Chart type 2 Please, enter the title of the graph: Expenses of Family Members Please,enter the number of family members: 4 Please,enter the name of member 1: Abed Please,enter the phone expenses for Abed: 50 Please,enter the shopping expenses for Abed: 200 Please,enter the transportation expenses for Abed: 300 Please,enter the name of member 2: Alex Please,enter the phone expenses for Alex: 0 Please, enter the shopping expenses for A1ex: 200 Please,enter the transportation expenses for Alex: 400 Please, enter the name of member 3: Nic 1e Please,enter the phone expenses for Nicole: 100 Please,enter the shopping expenses for Nicole: 0 Please, enter the tranaportation expenses for Nicole: 250 Please, enter the name of member 4: Rita Please,enter the phone expenses for Rita: 100 Please,enter the shopping expenses for Rita: 375 Ple??3e, enter the transportation expenses for Rita: 0
Step by Step Solution
There are 3 Steps involved in it

Get step-by-step solutions from verified subject matter experts