

Question: Using software d to plot three graphs using this temperature difference versus time data (you may use any graphing program such as MS Excel or
- Using software d to plot three graphs using this temperature difference versus time data (you may use any graphing program such as MS Excel or Google Sheets- be sure to paste them onto a Word Document or PDF).
- Temperature difference vs. time
- ln Temperature difference vs. time (natural log of the temperature difference versus time)
- Temperature difference-1 vs. time (the reciprocal of the temperature difference versus time)
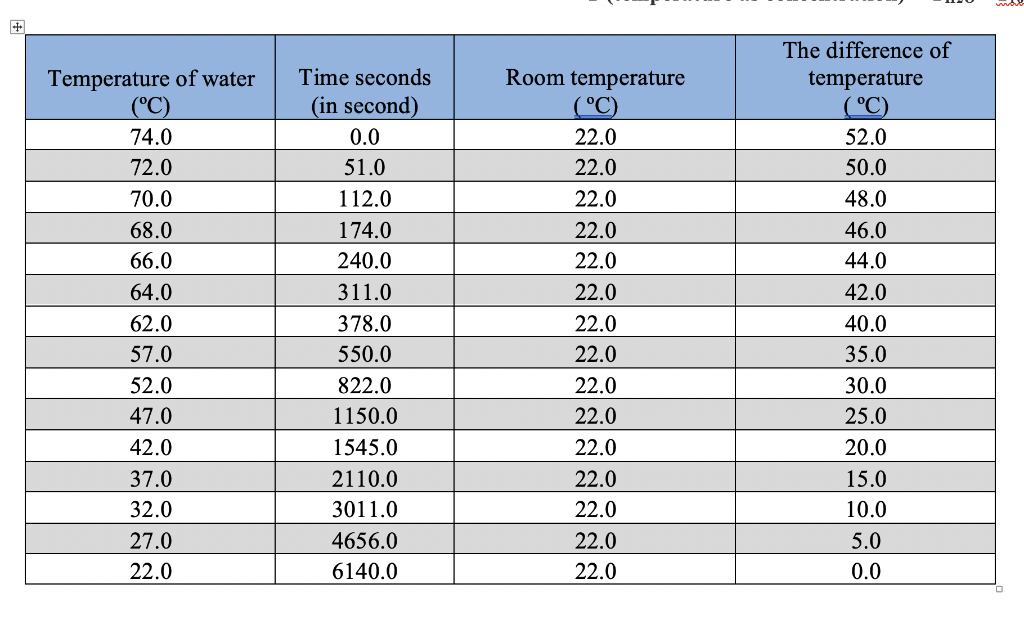
Data Table
- Determine the slope of the line; this is your value for k, the rate constant.
- Write the rate law for the cooling of water. This should take the form of Rate = k[temperature difference]n with the values for k and n substituted.
- Using what you know about heat and kinetic energy, and what you have learned on order of reactions, justify the order you determined for the cooling of water.
DU wa Temperature of water (C) 74.0 72.0 70.0 68.0 66.0 64.0 62.0 57.0 52.0 47.0 42.0 37.0 32.0 27.0 22.0 Time seconds (in second) 0.0 51.0 112.0 174.0 240.0 311.0 378.0 550.0 822.0 1150. 0 0 1545.0 2110.0 3011.0 4656.0 6140.0 Room temperature (C) 22.0 22.0 22.0 22.0 22.0 22.0 22.0 22.0 22.0 22.0 22.0 22.0 22.0 22.0 22.0 The difference of temperature (C) 52.0 50.0 48.0 46.0 44.0 42.0 40.0 35.0 30.0 25.0 20.0 15.0 10.0 5.0 0.0 DU wa Temperature of water (C) 74.0 72.0 70.0 68.0 66.0 64.0 62.0 57.0 52.0 47.0 42.0 37.0 32.0 27.0 22.0 Time seconds (in second) 0.0 51.0 112.0 174.0 240.0 311.0 378.0 550.0 822.0 1150. 0 0 1545.0 2110.0 3011.0 4656.0 6140.0 Room temperature (C) 22.0 22.0 22.0 22.0 22.0 22.0 22.0 22.0 22.0 22.0 22.0 22.0 22.0 22.0 22.0 The difference of temperature (C) 52.0 50.0 48.0 46.0 44.0 42.0 40.0 35.0 30.0 25.0 20.0 15.0 10.0 5.0 0.0
Step by Step Solution
There are 3 Steps involved in it

Get step-by-step solutions from verified subject matter experts