

Question: Using the annexes provided (specially #5), compare financial ratios over the years. Prepare an analysis for each ratio working for the years 2014 to 2017.
Using the annexes provided (specially #5), compare financial ratios over the years. Prepare an analysis for each ratio working for the years 2014 to 2017.
a. How do the liquidity ratios compare for the years 2014 to 2017? Please compare one year to another.
b. How do the solvency ratios (debt) compare for the years 2014 to 2017? Please compare one year to another.
c. How do the operational ratios compare for the years 2014 to 2017? Please compare one year to another.
d. How do the profit ratios (profitability) compare for the years 2014 to 2017? Please compare one year to another.
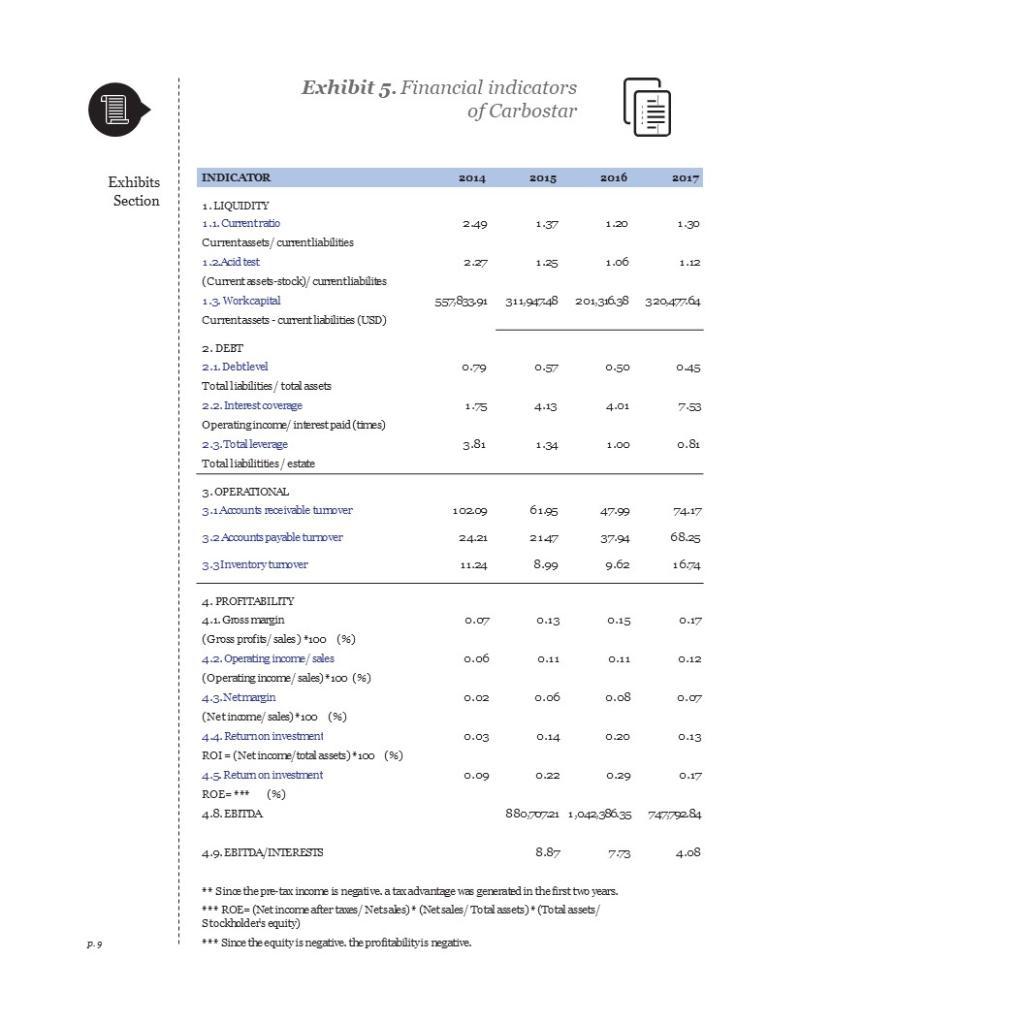
1 P.9 Exhibits Section INDICATOR Exhibit 5. Financial indicators of Carbostar 1.LIQUIDITY 1.1. Currentratio Currentassets/ currentliabilities 1.2.Acid test (Current assets-stock)/ currentliabilites 1.3. Workcapital Currentassets-current liabilities (USD) 2. DEBT 2.1. Debtlevel Total liabilities/total assets 2.2. Interest coverage Operating income/ interest paid (times) 2.3. Totalleverage Total liabilitities/estate 3.OPERATIONAL 3.1 Accounts receivable tumover 3.2 Accounts payable turnover 3.3 Inventory turnover 4. PROFITABILITY 4.1. Gross margin (Gross profits/sales) *100 (%) 4.2. Operating income/sales (Operating income/sales)*100 (%) 4.3.Netmargin (Netiname/ sales) 100 (96) 4-4. Return on investment ROI = (Net income/total assets)*100 (%) 4-5. Return on investment ROE=*** (%) 4.8. EBITDA 4.9. EBITDA/INTERESTS 2014 2.49 2.27 0.79 1.75 3.81 102.09 24.21 11.24 0.07 0.06 557,833-91 311,94748 201,316.38 320,477.64 0.02 0.03 2015 0.09 1.37 1.25 0.57 4.13 1.34 61.95 2147 8.99 0.13 0.11 0.06 0.14 0.22 2016 1.20 8.87 1.06 0.50 4.01 1.00 47.99 37.94 9.62 0.15 0.11 0.08 0.20 0.29 2017 7:73 1.30 ** Since the pre-tax income is negative, a tax advantage was generated in the first two years. *** ROE= (Net income after taxes/Netsales) (Net sales/Total assets) (Total assets/ Stockholder's equity) *** Since the equity is negative, the profitability is negative. 1.12 045 7-53 0.81 74-17 68.25 16.74 0.17 0.12 0.07 88070721 1,042,38635 7471792.84 0.13 0.17 4.08
Step by Step Solution
3.49 Rating (156 Votes )
There are 3 Steps involved in it
A Liquidity Ratios 2014 Current Ratio 151 Quick Ratio 082 2015 Current Ratio 163 Quick Ratio 093 2016 Current Ratio 164 Quick Ratio 093 2017 Current R... View full answer

Get step-by-step solutions from verified subject matter experts