

Question: Using the basic developed MATLAB signal functions, generate the following sequences and then plot the signal samples using the stem function. x_1[n] = 3 delta[n
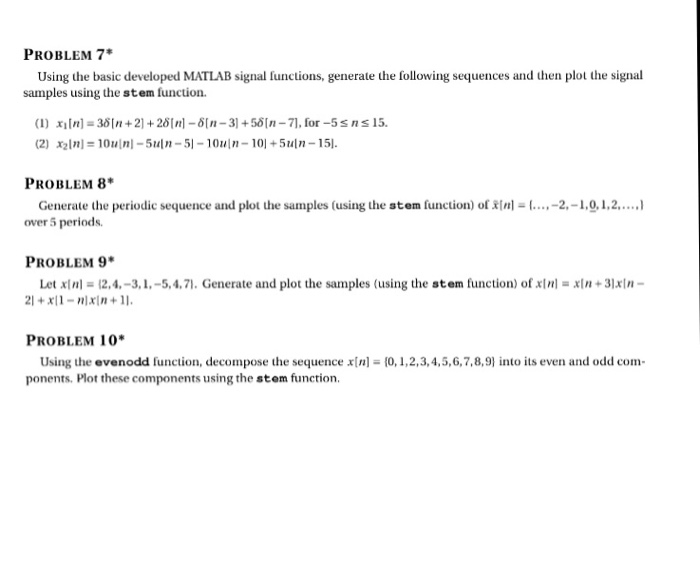
Using the basic developed MATLAB signal functions, generate the following sequences and then plot the signal samples using the stem function. x_1[n] = 3 delta[n + 2] + 2 delta[n] - delta[n - 3] + 5 delta[n - 7], for -5 lessthanorequalto n lessthanorequalto 15. X_2[n] = 10u[n] - 5u[n - 5] - 10u[n - 10] + 5u[n - 15]. Generate the periodic sequence and plot the samples (using the stem function) of cap x[n] = {..., -2, -1, 0, 1, 2, ..., } over 5 periods. Let x[n] = {2, 4, -3, 1, -5, 4, 7}. Generate and plot the samples (using the stem function) of x[n] = x[n + 3]x[n - 2] + x[1 - n]x[n + 1]. Using the evenodd function, decompose the sequence x[n] = {0, 1, 2, 3, 4, 5, 6, 7, 8, 9} into its even and odd components. Plot these components using the stem function
Step by Step Solution
There are 3 Steps involved in it

Get step-by-step solutions from verified subject matter experts