

Question: Using the data below, graph the supply and demand curves for metal water bottles of your favourite music group/ performer. Quantity supplied 0d 03 after
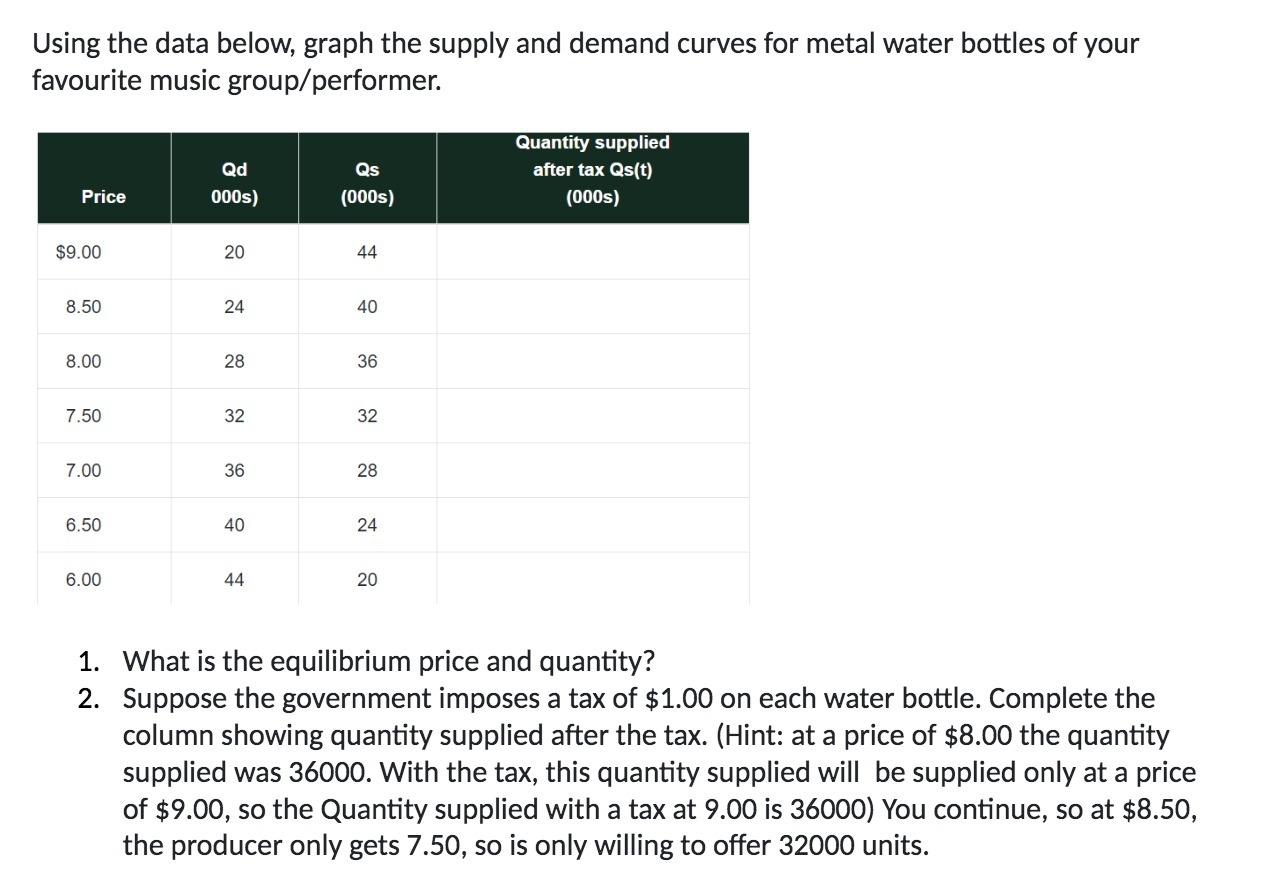
Using the data below, graph the supply and demand curves for metal water bottles of your favourite music group/ performer. Quantity supplied 0d 03 after tax Qslt] Price 0005) (0005) {0005) $9.00 20 44 8.50 24 40 8.00 28 36 7 .50 32 32 7.00 36 28 6.50 40 24 5.00 44 20 1. What is the equilibrium price and quantity? 2. Suppose the government imposes a tax of $1.00 on each water bottle. Complete the column showing quantity supplied after the tax. (Hint: at a price of $8.00 the quantity supplied was 36000. With the tax, this quantity supplied will be supplied only at a price of $9.00, so the Quantity supplied with a tax at 9.00 is 36000) You continue, so at $8.50, the producer only gets 7.50, so is only willing to offer 32000 units
Step by Step Solution
There are 3 Steps involved in it

Get step-by-step solutions from verified subject matter experts