

Question: Using the data from Exercise 2.1, calculate MAD and MAPE for exponential smoothing forecasts with a 5 0.3 and with a 5 0.5. Does varying
Using the data from Exercise 2.1, calculate MAD and MAPE for exponential smoothing forecasts with a 5 0.3 and with a 5 0.5. Does varying the values of a provide a more accurate forecast?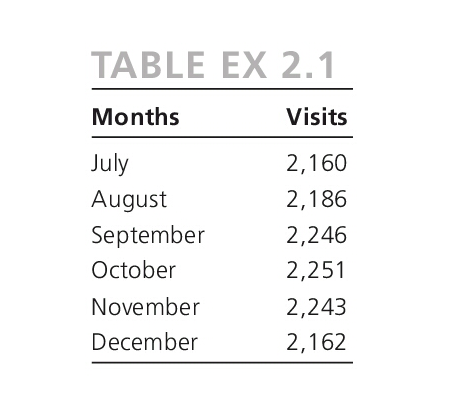
TABLE EX 2. Months July August September October November December Visits 2,160 2,186 2,246 2,251 2,243 2,162
Step by Step Solution
There are 3 Steps involved in it
1 Expert Approved Answer
Step: 1 Unlock

Question Has Been Solved by an Expert!
Get step-by-step solutions from verified subject matter experts
Step: 2 Unlock
Step: 3 Unlock