

Question: Using the data in the following table, and the fact that the correlation of A and B is 0 . 6 5 , calculate the
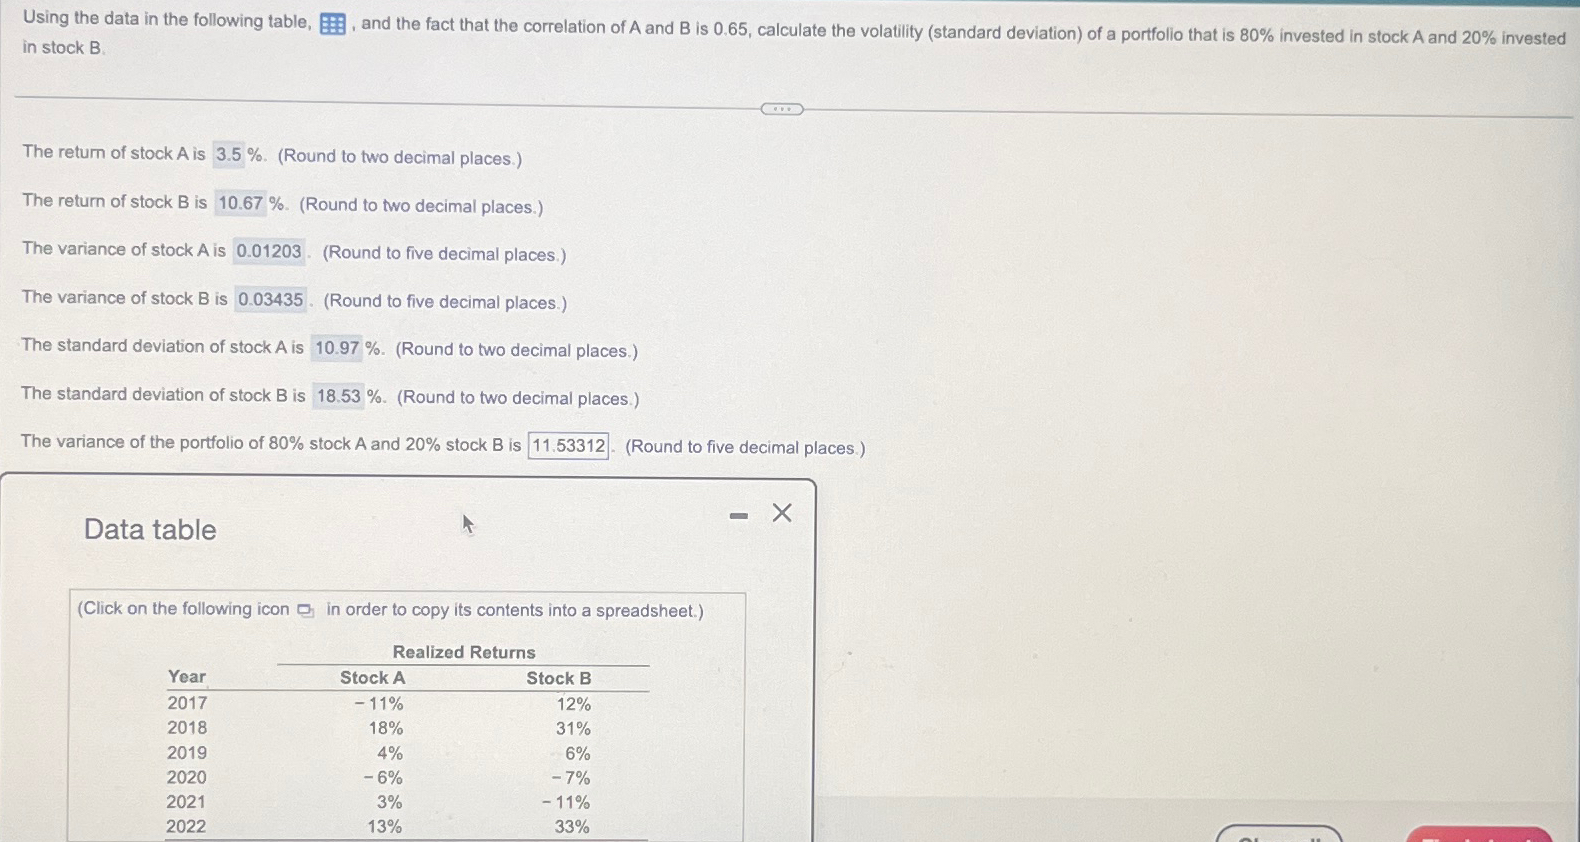
Using the data in the following table, and the fact that the correlation of A and B is calculate the volatility standard deviation of a portfolio that is invested in stock A and invested in stock
The return of stock is Round to two decimal places.
The return of stock is Round to two decimal places.
The variance of stock is Round to five decimal places.
The variance of stock is Round to five decimal places.
The standard deviation of stock is
Round to two decimal places.
The standard deviation of stock is
Round to two decimal places.
The variance of the portfolio of stock A and stock B is Round to five decimal places.
Data table
Click on the following icon in order to copy its contents into a spreadsheet.
tableRealized ReturnsYearStock AStock B
Please help with the last question "the variancr of the portfolio of Stock A and stoch B is ANSWERround to five decimal places
Step by Step Solution
There are 3 Steps involved in it
1 Expert Approved Answer
Step: 1 Unlock

Question Has Been Solved by an Expert!
Get step-by-step solutions from verified subject matter experts
Step: 2 Unlock
Step: 3 Unlock