

Question: Using the data in the following table, Eestimate the: a. Average return and volatility for each stock. b. Covariance between the stocks. c. Correlation between
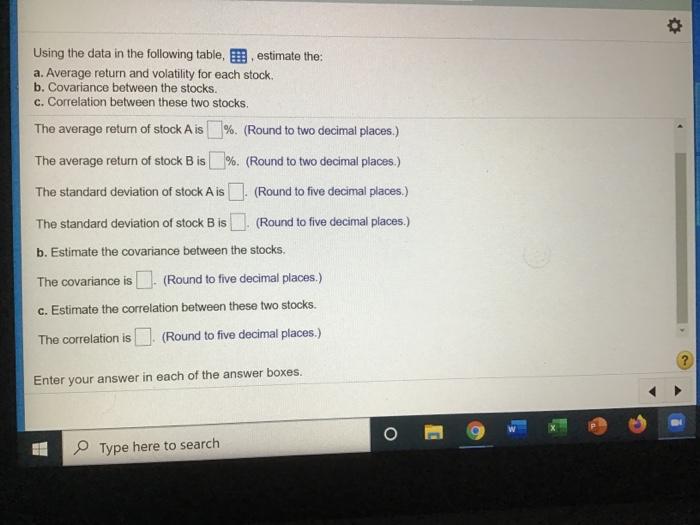
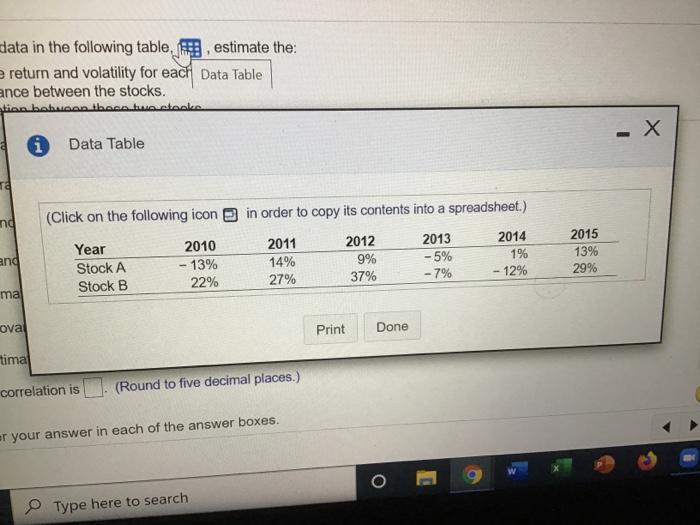
Using the data in the following table, Eestimate the: a. Average return and volatility for each stock. b. Covariance between the stocks. c. Correlation between these two stocks, The average return of stock Ais %. (Round to two decimal places.) The average return of stock B is l%. (Round to two decimal places.) The standard deviation of stock Ais . (Round to five decimal places.) The standard deviation of stock B is. (Round to five decimal places.) b. Estimate the covariance between the stocks. The covariance is . (Round to five decimal places.) c. Estimate the correlation between these two stocks. The correlation is (Round to five decimal places.) Enter your answer in each of the answer boxes. Type here to search data in the following table, p. estimate the: e return and volatility for each Data Table ance between the stocks. i Data Table Ta ng (Click on the following icon in order to copy its contents into a spreadsheet.) Year Stock A Stock B and 2010 - 13% 22% 2011 14% 27% 2012 9% 37% 2013 -5% -7% 2014 1% - 12% 2015 13% 29% ma ova Print Done tima correlation is. (Round to five decimal places.) er your answer in each of the answer boxes. O Type here to search
Step by Step Solution
There are 3 Steps involved in it

Get step-by-step solutions from verified subject matter experts