

Question: Using the data in the following table, Eestimate the: a. Average return and volatility for each stock. b. Covariance between the stocks. c. Correlation between
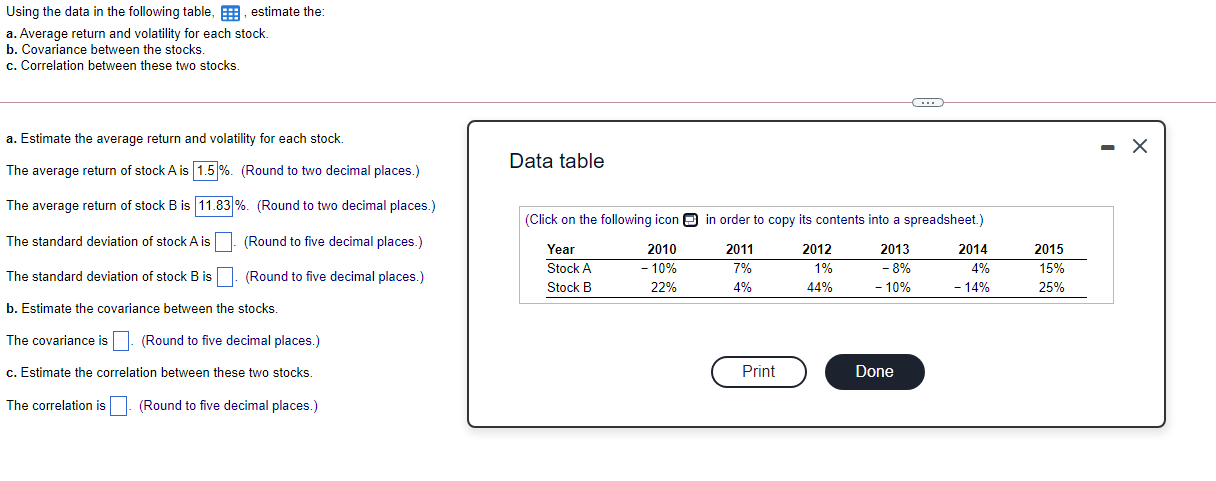
Using the data in the following table, Eestimate the: a. Average return and volatility for each stock. b. Covariance between the stocks. c. Correlation between these two stocks. . a. Estimate the average return and volatility for each stock. - Data table The average return of stock Ais 1.5%. (Round to two decimal places.) The average return of stock B is 11.83 %. (Round to two decimal places.) (Click on the following icon in order to copy its contents into a spreadsheet.) The standard deviation of stock A is (Round to five decimal places.) 2010 Year Stock A Stock B 2011 7% 4% 2012 1% 44% - 10% 22% 2013 -8% - 10% 2014 4% 14% 2015 15% 25% The standard deviation of stock B is (Round to five decimal places.) b. Estimate the covariance between the stocks. The covariance is . (Round to five decimal places.) c. Estimate the correlation between these two stocks. Print Done The correlation is (Round to five decimal places.)
Step by Step Solution
There are 3 Steps involved in it

Get step-by-step solutions from verified subject matter experts