

Question: Using the data in the following table, , estimate the: a. Average return and volatility for each stock. b. Covariance between the stocks. c. Correlation
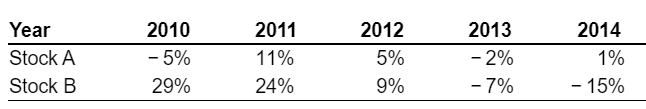
Using the data in the following table, , estimate the: a. Average return and volatility for each stock. b. Covariance between the stocks. c. Correlation between these two stocks. a. Estimate the average return and volatility for each stock. The average return of stock A is %. (Round to two decimal places.) The average return of stock B is %. (Round to two decimal places.) The standard deviation of stock A is . (Round to five decimal places.) The standard deviation of stock B is . (Round to five decimal places.) \begin{tabular}{lrrrrr} Year & 2010 & 2011 & 2012 & 2013 & 2014 \\ \hline Stock A & 5% & 11% & 5% & 2% & 1% \\ Stock B & 29% & 24% & 9% & 7% & 15% \\ \hline \end{tabular}
Step by Step Solution
There are 3 Steps involved in it

Get step-by-step solutions from verified subject matter experts