

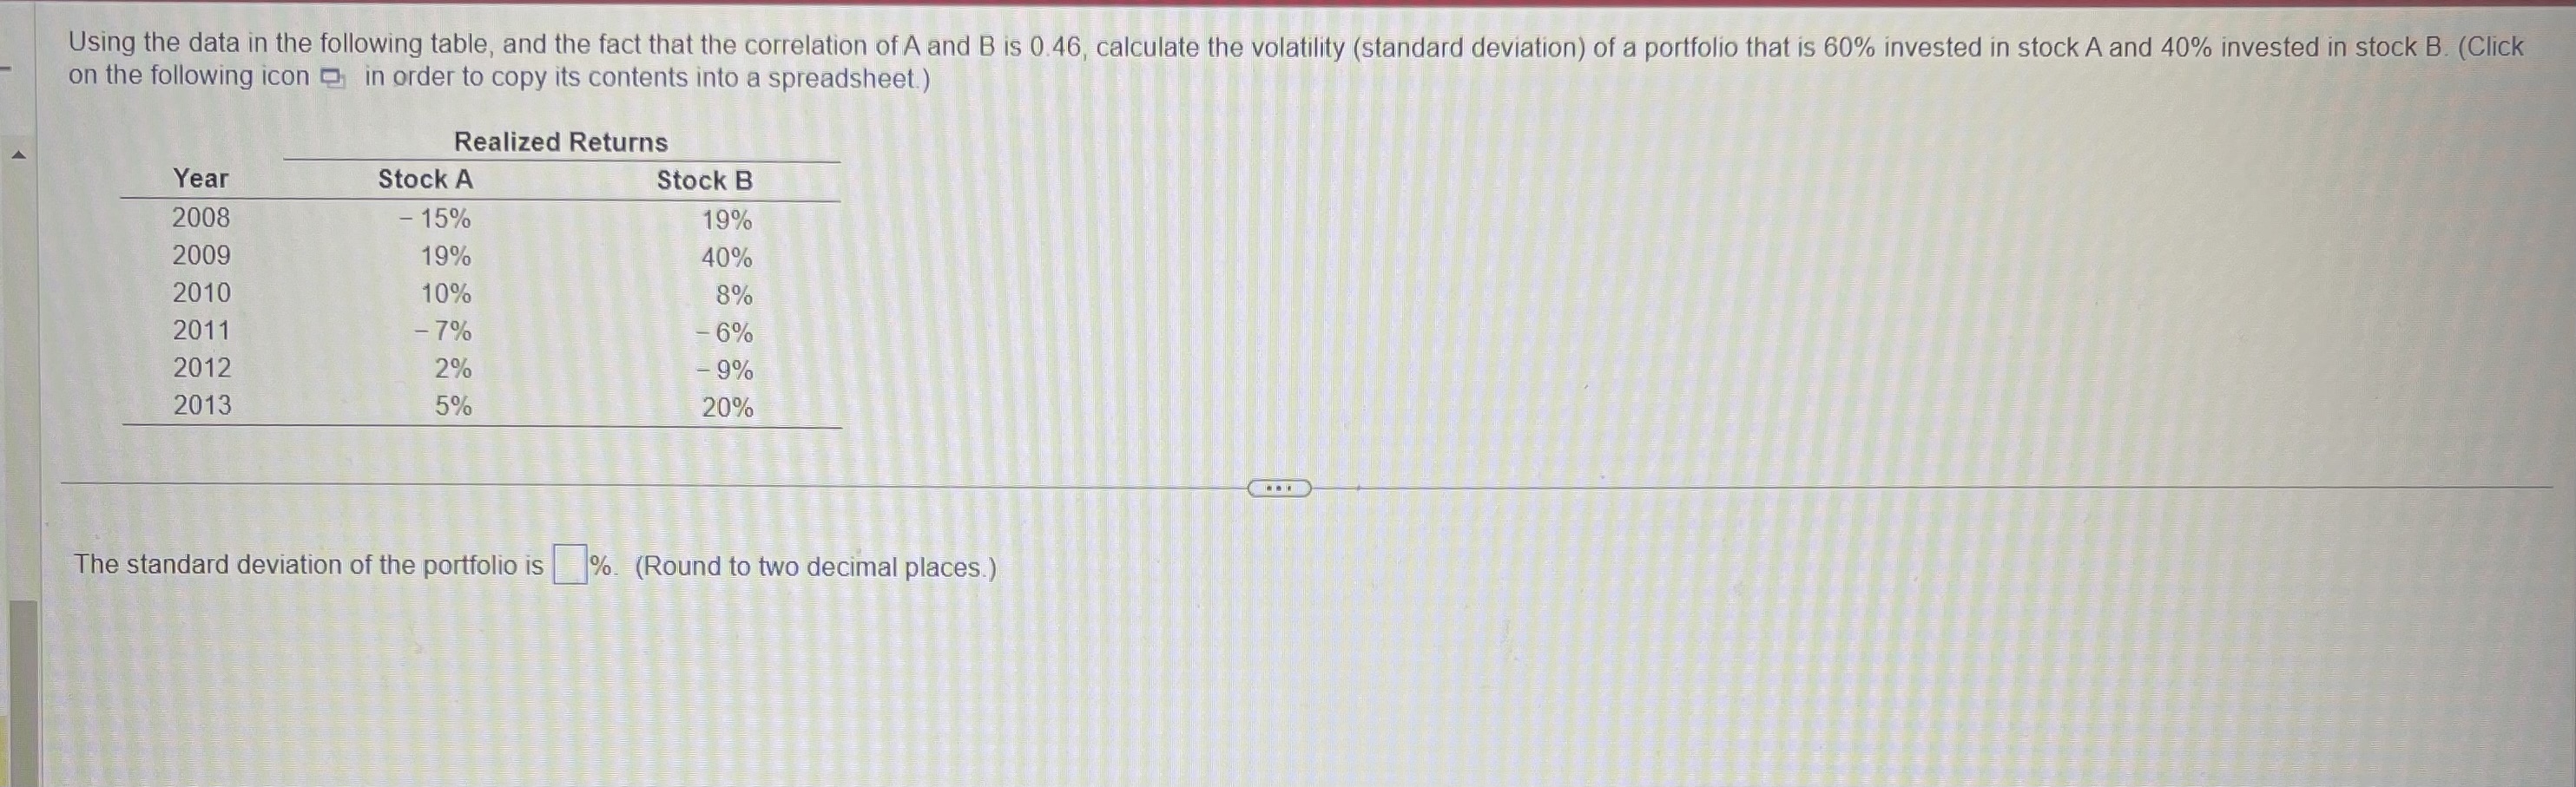
Question: Using the data in the following table ( I attached image ) , and the fact that the correlation of A and B is 0
Using the data in the following table I attached image and the fact that the correlation of A and B is calculate the volatility standard deviation of a portfolio that is invested in stock A and invested in stock B
Step by Step Solution
There are 3 Steps involved in it
1 Expert Approved Answer
Step: 1 Unlock

Question Has Been Solved by an Expert!
Get step-by-step solutions from verified subject matter experts
Step: 2 Unlock
Step: 3 Unlock