

Question: using the excel output : Now, interpret and estimate SUMMARY OUTPUT Regression Statistics Multiple R 0.506048224 R Square 0.256084805 Adjusted R Sq 0.252342777 Standard Erro
using the excel output : Now, interpret and estimate
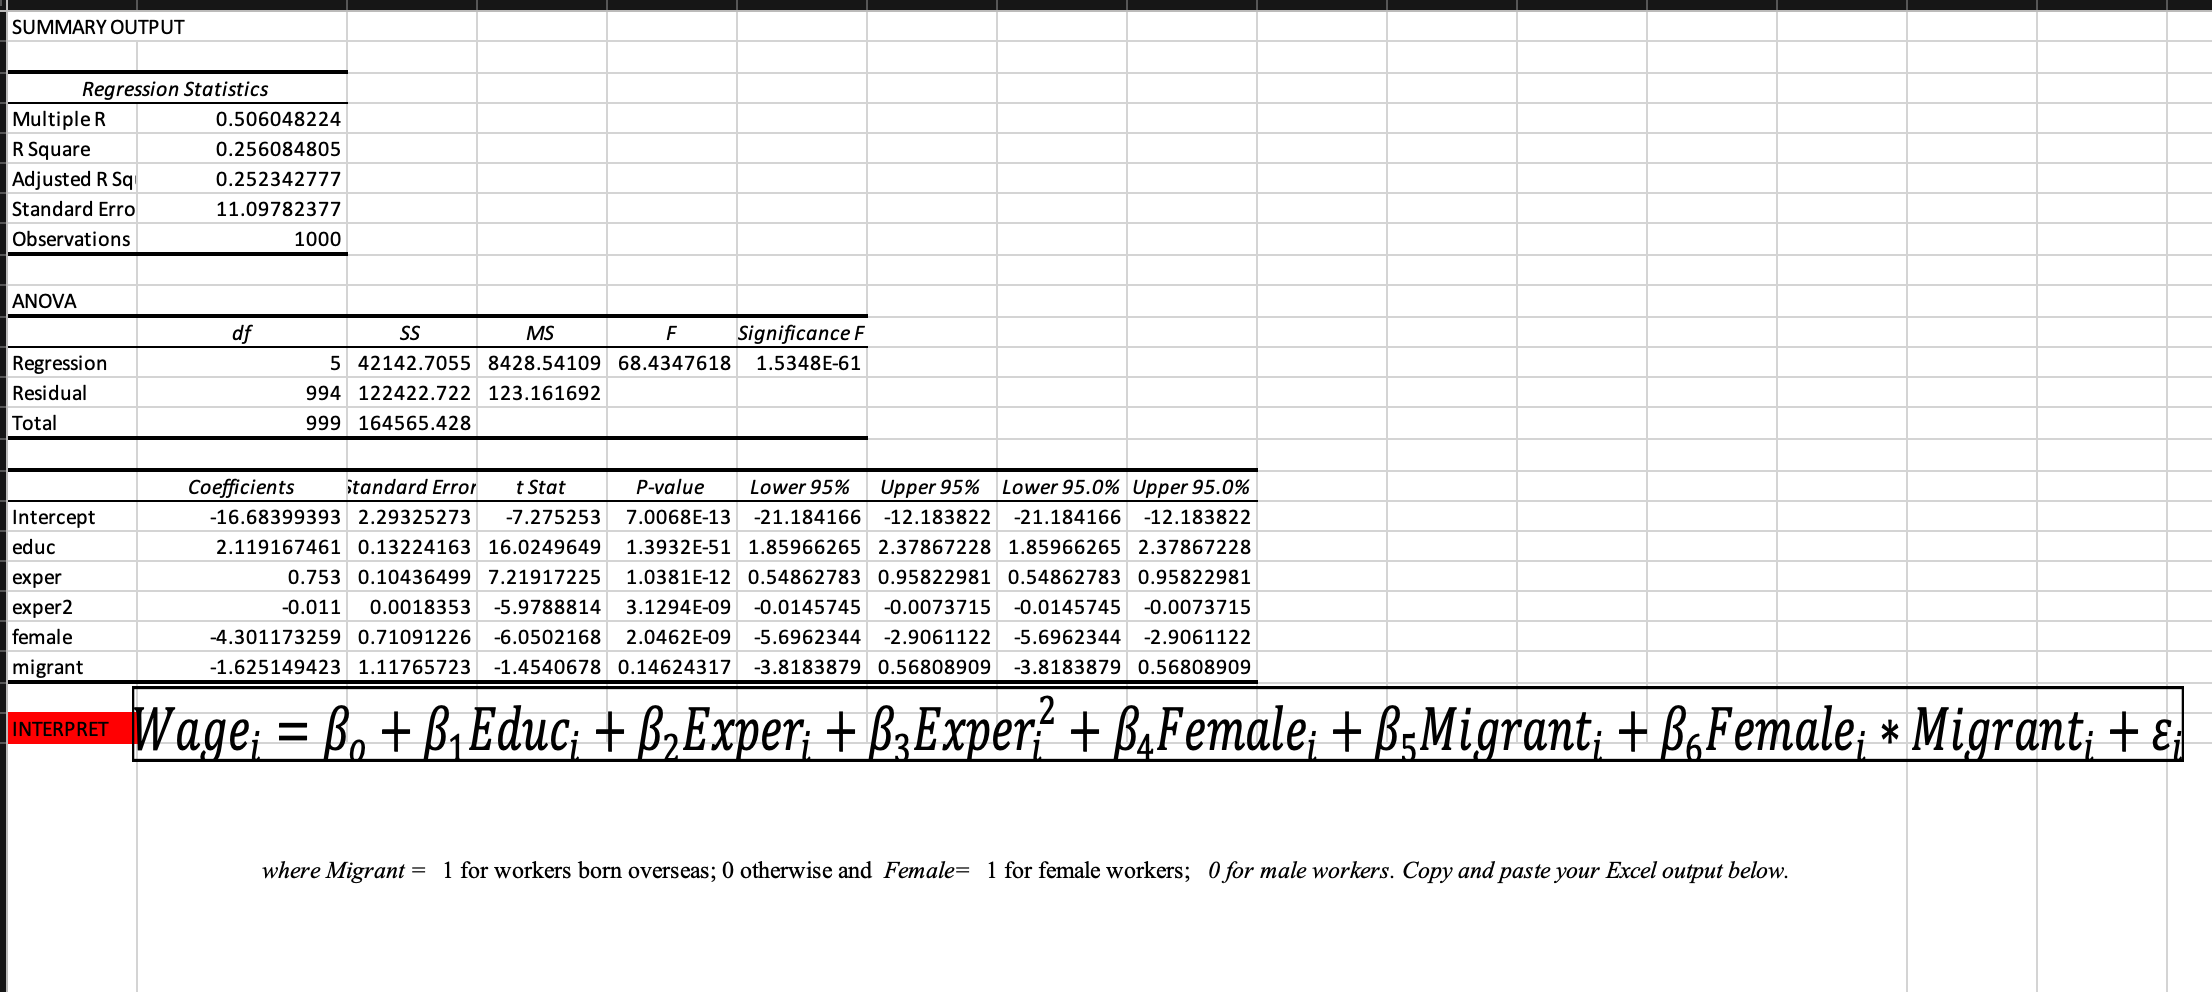
SUMMARY OUTPUT Regression Statistics Multiple R 0.506048224 R Square 0.256084805 Adjusted R Sq 0.252342777 Standard Erro 11.09782377 Observations 1000 ANOVA SS MS F Significance F Regression 5 42142.7055 8428.54109 68.4347618 1.5348E-61 Residual 994 122422.722 123.161692 Total 999 164565.428 Coefficients Standard Error t Stat P-value Lower 95% Upper 95% Lower 95.0% Upper 95.0% Intercept -16.68399393 2.29325273 -7.275253 7.0068E-13 -21.184166 -12.183822 -21.184166 -12.183822 educ 2.119167461 0.13224163 16.0249649 1.3932E-51 1.85966265 2.37867228 1.85966265 2.37867228 exper 0.753 0.10436499 7.21917225 1.0381E-12 0.54862783 0.95822981 0.54862783 0.95822981 exper2 -0.011 0.0018353 -5.9788814 3.1294E-09 -0.0145745 -0.0073715 -0.0145745 -0.0073715 female -4.301173259 0.71091226 -6.0502168 2.0462E-09 -5.6962344 -2.9061122 -5.6962344 -2.9061122 migrant 1.625149423 1.11765723 -1.4540678 0.14624317 -3.8183879 0.56808909 -3.8183879 0.56808909 INTERPRET Wage; = Bo + B, Educ; + B,Exper; + B,Expert + B,Female; + B Migrant; + BoFemale; * Migrant; + & where Migrant = 1 for workers born overseas; 0 otherwise and Female= 1 for female workers; 0 for male workers. Copy and paste your Excel output below
Step by Step Solution
There are 3 Steps involved in it

Get step-by-step solutions from verified subject matter experts