

Question: Using the graph below, please describe the situation to a colleague who may not have studied biostatistics. 100 Gene A signature 50 Gene B signature
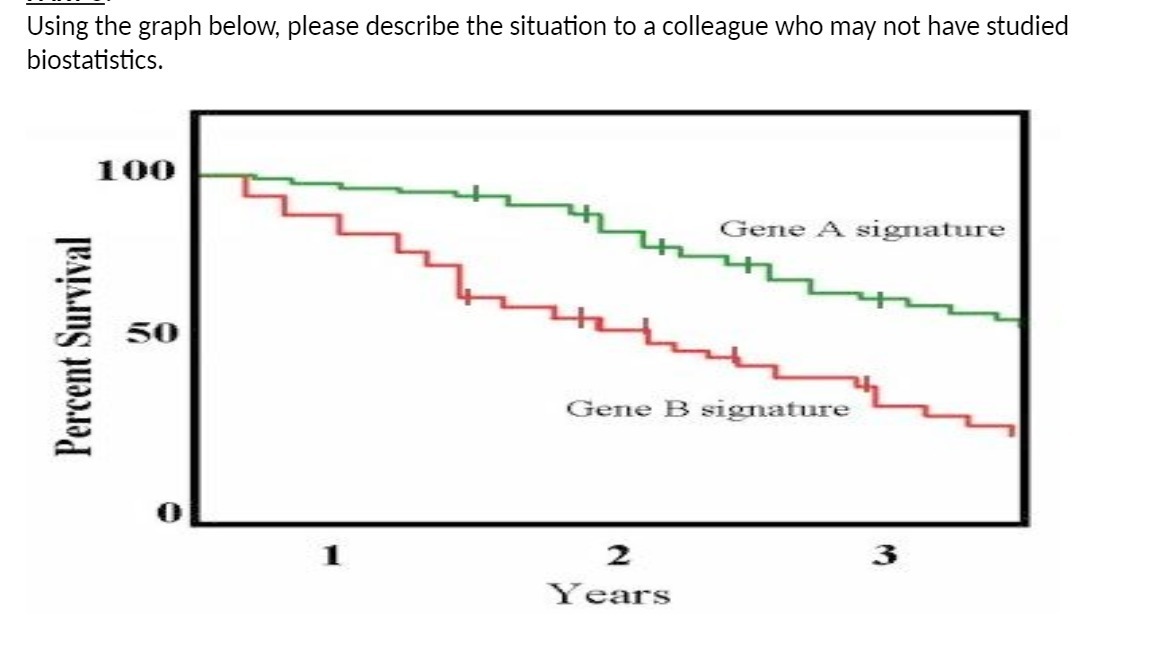
Using the graph below, please describe the situation to a colleague who may not have studied biostatistics. 100 Gene A signature 50 Gene B signature Percent Survival 'Years
Step by Step Solution
There are 3 Steps involved in it
1 Expert Approved Answer
Step: 1 Unlock

Question Has Been Solved by an Expert!
Get step-by-step solutions from verified subject matter experts
Step: 2 Unlock
Step: 3 Unlock