

Question: Using the orange curve ( square symbols ) , plot the present value of each of the expected future dividends for years 1 0 ,
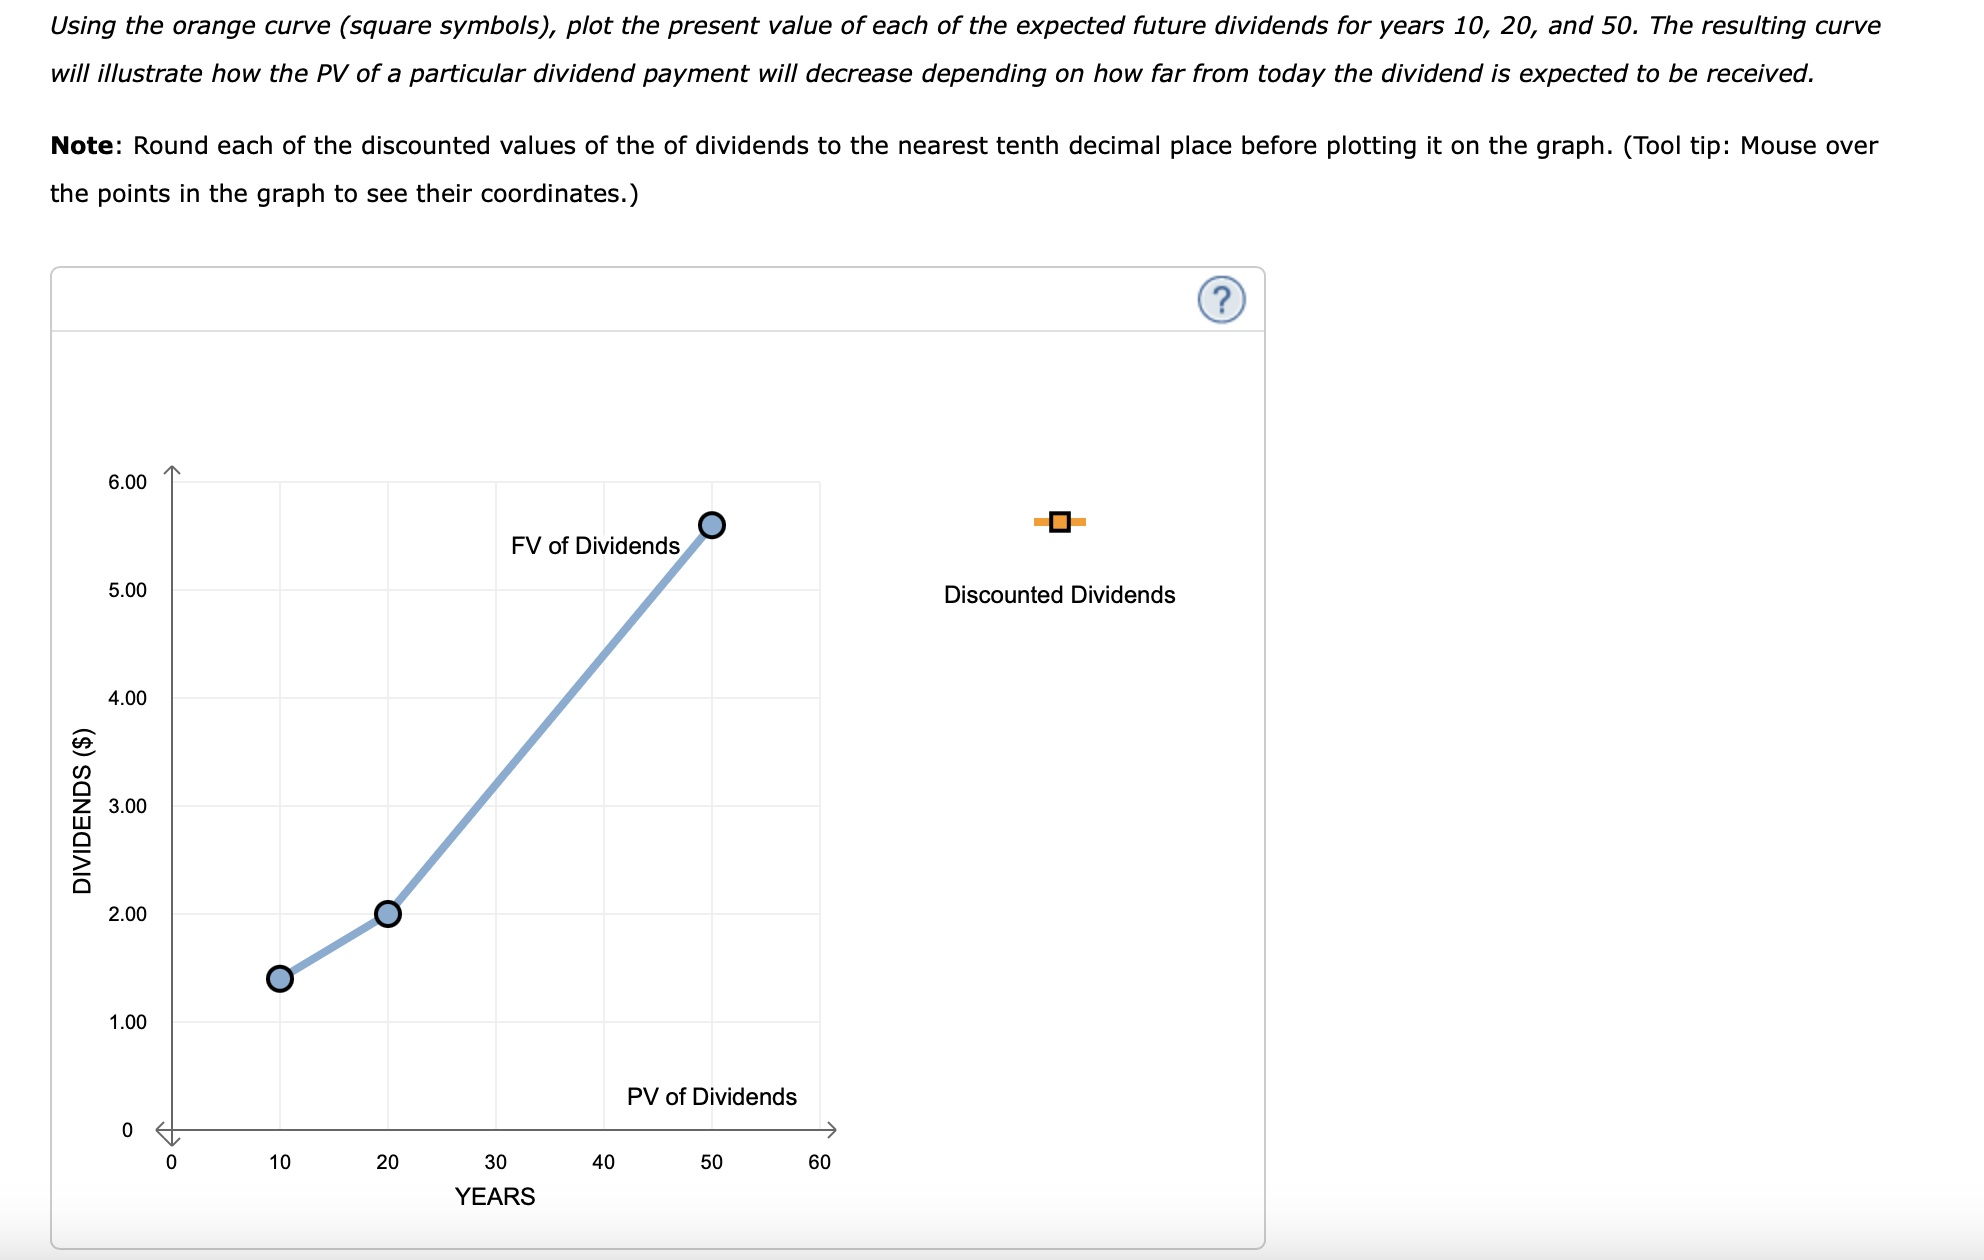
Using the orange curve square symbols plot the present value of each of the expected future dividends for years and The resulting curve
will illustrate how the PV of a particular dividend payment will decrease depending on how far from today the dividend is expected to be received.
Note: Round each of the discounted values of the of dividends to the nearest tenth decimal place before plotting it on the graph. Tool tip: Mouse over
the points in the graph to see their coordinates.
Step by Step Solution
There are 3 Steps involved in it
1 Expert Approved Answer
Step: 1 Unlock

Question Has Been Solved by an Expert!
Get step-by-step solutions from verified subject matter experts
Step: 2 Unlock
Step: 3 Unlock