

Question: Using the Quarterly Sales Data, (refer to image provided) Assume there is no trend & Compute the four seasonal index values. Further, with a forecasted
Using the Quarterly Sales Data, (refer to image provided)
Assume there is no trend & Compute the four seasonal index values. Further, with a forecasted total demand for year 5 of 997 determine the seasonally adjusted forecast for each of the four quarters of year 5. (Round all answers to 4 decimal places)
?
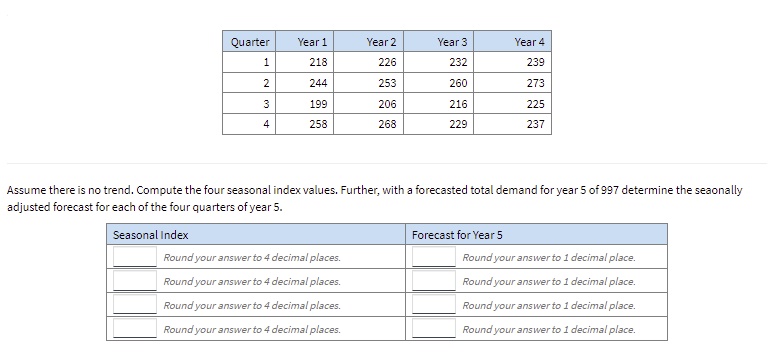
Quarter Year 1 Year 2 Year 3 Year 4 218 226 232 239 2 244 253 260 273 3 199 206 216 225 4 258 268 229 237 Assume there is no trend. Compute the four seasonal index values. Further, with a forecasted total demand for year 5 of 997 determine the seaonally adjusted forecast for each of the four quarters of year 5. Seasonal Index Forecast for Year 5 Round your answer to 4 decimal places. Round your answer to 1 decimal place. Round your answer to 4 decimal places. Round your answer to 1 decimal place. Round your answer to 4 decimal places. Round your answer to 1 decimal place. Round your answer to 4 decimal places. Round your answer to 1 decimal place
Step by Step Solution
There are 3 Steps involved in it

Get step-by-step solutions from verified subject matter experts