

Question: Using the scenario and data for SPC Assignment 1, determine the capability of the process. Calculate both Cp and Cpk. Based among these, state if
Using the scenario and data for SPC Assignment 1, determine the capability of the process. Calculate both Cp and Cpk. Based among these, state if the process is capable are you reason for concluding this? Assume that the histogram of the individual measurements is approximately bell-shaped. Estimate the percentage of items that will: 1. Meet the specifications 2. Exceed the upper specification limit 3. Fall below the lower specification limit Instructions Submit a very neatly prepared page of handwritten calculations. You may NOT use Excel (or similar software). Calculate the estimated process standard deviation to 3 decimal places. Round all other final calculations to two (2) decimal places. For example, show Cp and Cpk as 1.23 and percentages as 5.64%.
Below was the assignment from Spec 1
UNGBrew Corporation produces instant coffee. They market their instant coffee in prepackaged coffee bags for customer convenience. Each bag contains enough coffee to brew eight (8) cups of coffee, the typical size coffee maker found in most retail stores. Production standards call for each bag to contain 100.0 +/- 2.0 grams of coffee. To be safe, the weight listed on the package is 98 grams (the lower specification limit). Government regulations state that the packages must meet the amount printed on the package. UNGBrew has requested that you, one of their process analysts, evaluate the capability of this process. In order to conduct your analysis you have had the Packaging Department select four (4) bags from the packaging line each hour for a 24 hour period. There were 25 sets of observations. 1) Develop the appropriate control chart(s) and examine the bag filling process. 2) Does the bag filling process appear to be stable during the period of time when the observations were made? Instructions When evaluating the control, include a table that shows the longest runs observed for all six of the run tests (the same way shown in the lecture video). In the end, you must state your conclusion about the process. Submit your calculations (neat and organized) You may NOT use Excel to do the calculations (so that you learn the process and are prepare for the test). Submit a very neatly prepared page of handwritten calculations. Round all calculations to two (2) decimal places. Plot the control charts using pencil and pen and a straight edge. Make it to scale and neat. The charts must clearly show and label the control limits, the ABC zones and the centerline. The y-axis must be clearly labeled with these components, i.e. show the numeric values. The charts presented in the lecture video represent properly formatted charts. Neatness counts.
the 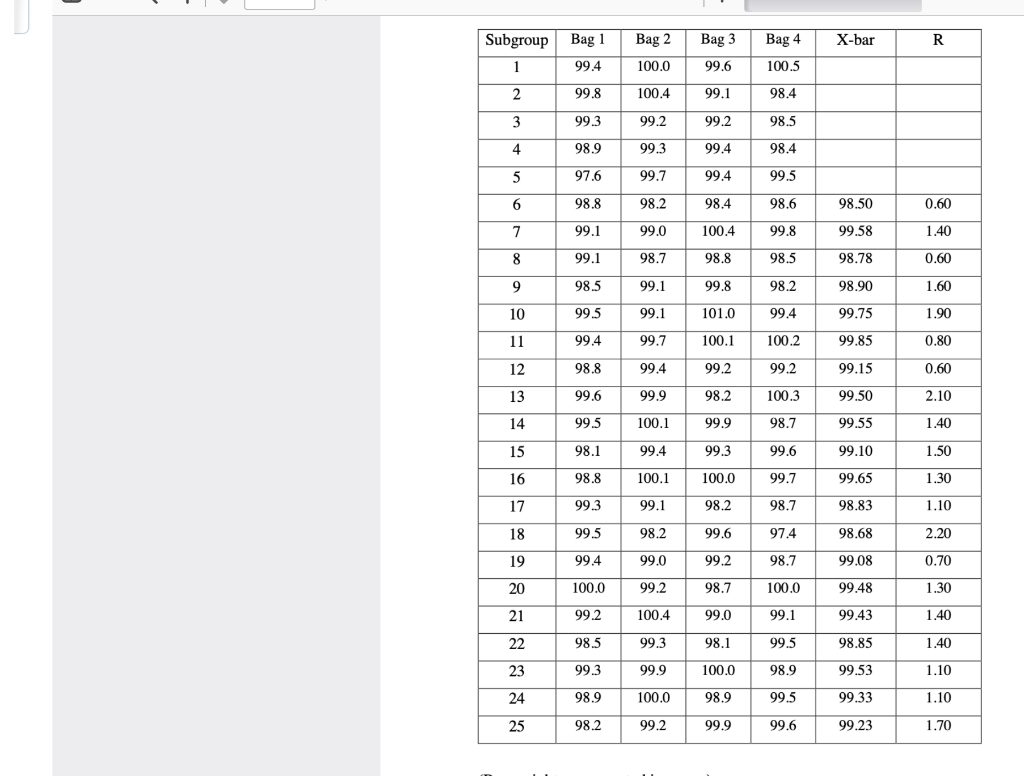 p
p
Step by Step Solution
There are 3 Steps involved in it

Get step-by-step solutions from verified subject matter experts