

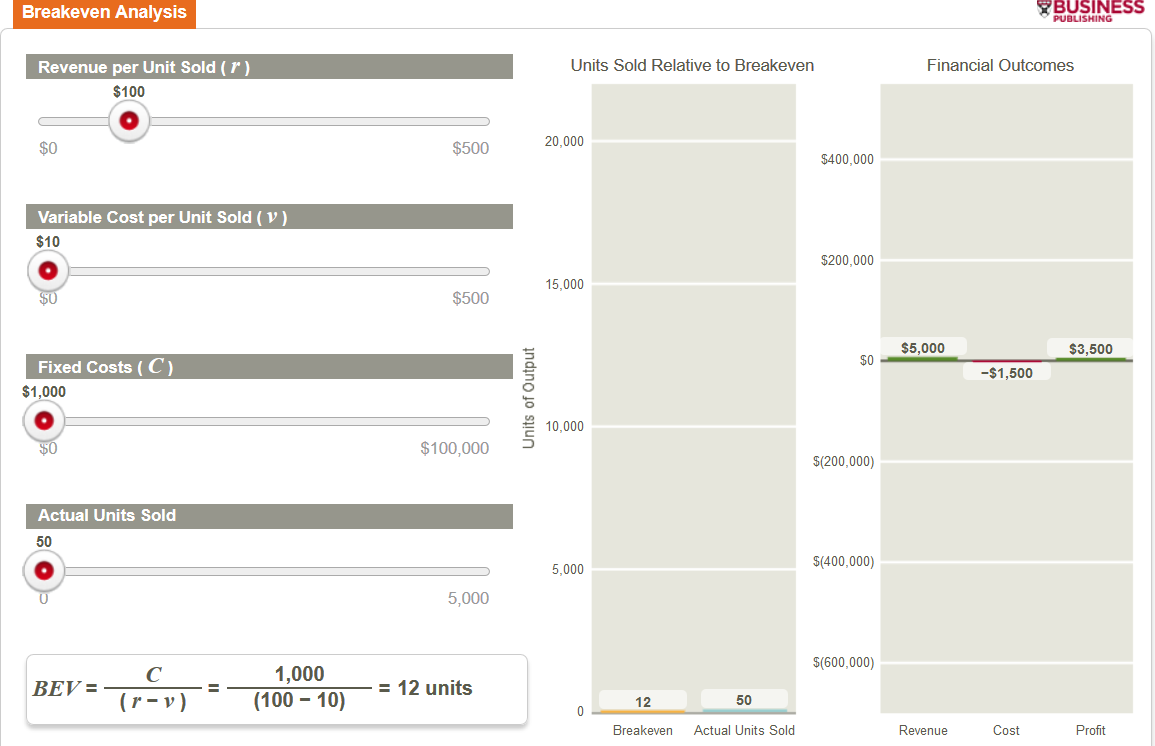
Question: Using the sliders in the Interactive Illustration given below, enter a hypothetical revenue per unit (r), variable cost per unit (v), and total fixed costs
Using the sliders in the Interactive Illustration given below, enter a hypothetical revenue per unit (r), variable cost per unit (v), and total fixed costs (C). The graph will display the output required to fully cover the firm's fixed costs in that scenario- breakeven volume. Analyze the changes and answer the following:
1. How does a change in total fixed costs (C) affect the breakeven point?
2. What happens when the variable cost per unit (v) approaches revenue per unit (r)? Why?
Step by Step Solution
There are 3 Steps involved in it
1 Expert Approved Answer
Step: 1 Unlock

Question Has Been Solved by an Expert!
Get step-by-step solutions from verified subject matter experts
Step: 2 Unlock
Step: 3 Unlock