

Question: Utilizing the DQ Week 3 Template in Week 3 materials, complete scenarios for each of the Aggregate Planning Strategies. Go to the data tab, copy
- Utilizing the DQ Week 3 Template in Week 3 materials, complete scenarios for each of the Aggregate Planning Strategies. Go to the data tab, copy the data in each column for Chase, Flex, and Level into the Cost column (right now the original column data is in the Cost column). Then click on Production tab and run Solver. You will need to this for each strategy.
- Once completed compare and contrast the results for each strategy in terms of soft costs (impact to people and brand image) and tangible costs (financials).
- Identify one company or industry which utilizes each of the strategies (exclusively) and identify how you see them implementing it.
Spreadsheet attached as image. 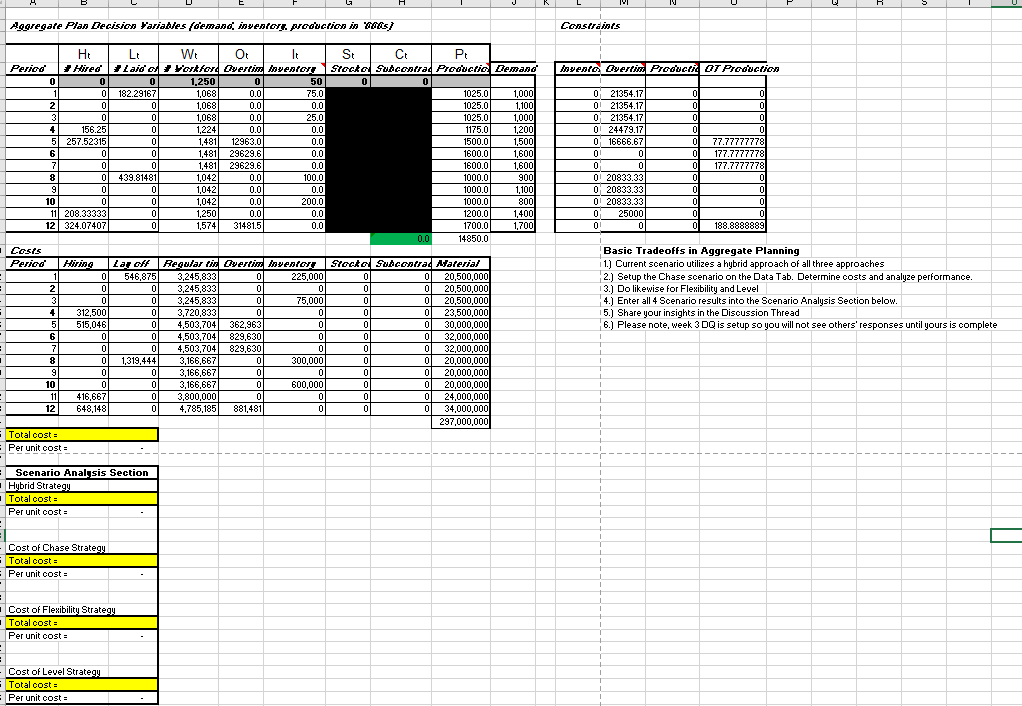
Aggregate Plan Decision Variables demand inventory production is worst Constraints Invenio Overtin Product OT Production 0 0 21354.17 0 21354.17 0 0 21354.17 024479.17 0 0 0 0 0 0 0 16666.67 0 0 0 77.77777778 177.7777778 177.7777778 0 0 0 0 0 0 0 0 0 0 0 0 020833.33 0 20833.33 0 20833.33 0 25000 0 0 188.8888889 0 0 Ht Lt W: OT It St Ct P Period Hired #Zaid' Vorkhord Overtin lavenior Srocko Subcontrad Productia Demand 0 0 0 1.250 0 50 0 0 1 0 182.29167 1,0681 0.0 75.0 1025.0 1,000 2 0 0 1,068 0.0 0.0 1025.0 1,100 3 0 0 1,068 0.0 25.0 1025.0 1,000 + 156.25 0 1,224 0.0 0.0 1175.0 1,200 5| 257.52315 0 1,481 12963.0 0.0 1500.0 1,500 6 0 0 1,481 29629.6 0.0 1600.0 1,600 7 011 0 1,481 29629.6 0.0 1600.0 1,600 8 01 439.81481 1,042 0.0 100.0 10000 900 9 0 0 1,042 0.0 0.0 1000.0 1,100 10 0 0 1,042 0.0 200.0 10000 800 11 208.33333 0 1,250 0.0 00 12000 1,400 12 324.07407 0 1,574 31481.5 0.0 1700.0 1,700 0.0 14850.0 Costs Period Hiring Lar oft Regular fit Overtin Inventor Srocka Suncontrad Material 1 0 546,875 3,245,833 0 225,000 0 0 20.500.000 2 0 0 3,245,833 0 0 0 0 20,500,000 3 0 0 3.245.8331 0 75,000 . 0 20,500,000 4 312,500 0 3,720,833 0 0 0 0 23,500,000 5 515,046 0 4.503.704 362,963 1 0 0 0 30,000,000 6 0 0 4,503,704 829,630 0 0 32,000,000 7 0 0 4,503,704 829,630 0 0 0 32,000,000 8 0 1,319,444 3,166,667 0 300,000 0 0 20,000,000 91 0 0 3.166.667 0 0 al 0 20,000,000 10 0 0 3,166,6671 0 600,000 Il 0 20,000,000 - 11 416,667 0 3,800,000 0 0 0 0 24,000,000 12 648,148 0 4,785,185 881,481 0 0 0 34,000,000 297,000,000 Total cost Per unit cost = = Basic Tradeoffs in Aggregate Planning 1.) Current scenario utilizes a hybrid approach of all three approaches 2.) Setup the Chase scenario on the Data Tab. Determine costs and analyze performance. 3.) Do likewise for Flexibility and Level 4.) Enter all 4 Scenario results into the Scenario Analysis Section below. 5.) Share your insights in the Discussion Thread 6.) Please note, week 3 DQ is setup so you will not see others' responses until yours is complete - 1 Scenario Analysis Section Hybrid Strategy Total cost = Per unit cost = Cost of Chase Strategy Total cost = Per unit cost Cost of Flexibility Strategy Total cost = Per unit cost Cost of Level Strategy Total cost = : Per unit cost : Aggregate Plan Decision Variables demand inventory production is worst Constraints Invenio Overtin Product OT Production 0 0 21354.17 0 21354.17 0 0 21354.17 024479.17 0 0 0 0 0 0 0 16666.67 0 0 0 77.77777778 177.7777778 177.7777778 0 0 0 0 0 0 0 0 0 0 0 0 020833.33 0 20833.33 0 20833.33 0 25000 0 0 188.8888889 0 0 Ht Lt W: OT It St Ct P Period Hired #Zaid' Vorkhord Overtin lavenior Srocko Subcontrad Productia Demand 0 0 0 1.250 0 50 0 0 1 0 182.29167 1,0681 0.0 75.0 1025.0 1,000 2 0 0 1,068 0.0 0.0 1025.0 1,100 3 0 0 1,068 0.0 25.0 1025.0 1,000 + 156.25 0 1,224 0.0 0.0 1175.0 1,200 5| 257.52315 0 1,481 12963.0 0.0 1500.0 1,500 6 0 0 1,481 29629.6 0.0 1600.0 1,600 7 011 0 1,481 29629.6 0.0 1600.0 1,600 8 01 439.81481 1,042 0.0 100.0 10000 900 9 0 0 1,042 0.0 0.0 1000.0 1,100 10 0 0 1,042 0.0 200.0 10000 800 11 208.33333 0 1,250 0.0 00 12000 1,400 12 324.07407 0 1,574 31481.5 0.0 1700.0 1,700 0.0 14850.0 Costs Period Hiring Lar oft Regular fit Overtin Inventor Srocka Suncontrad Material 1 0 546,875 3,245,833 0 225,000 0 0 20.500.000 2 0 0 3,245,833 0 0 0 0 20,500,000 3 0 0 3.245.8331 0 75,000 . 0 20,500,000 4 312,500 0 3,720,833 0 0 0 0 23,500,000 5 515,046 0 4.503.704 362,963 1 0 0 0 30,000,000 6 0 0 4,503,704 829,630 0 0 32,000,000 7 0 0 4,503,704 829,630 0 0 0 32,000,000 8 0 1,319,444 3,166,667 0 300,000 0 0 20,000,000 91 0 0 3.166.667 0 0 al 0 20,000,000 10 0 0 3,166,6671 0 600,000 Il 0 20,000,000 - 11 416,667 0 3,800,000 0 0 0 0 24,000,000 12 648,148 0 4,785,185 881,481 0 0 0 34,000,000 297,000,000 Total cost Per unit cost = = Basic Tradeoffs in Aggregate Planning 1.) Current scenario utilizes a hybrid approach of all three approaches 2.) Setup the Chase scenario on the Data Tab. Determine costs and analyze performance. 3.) Do likewise for Flexibility and Level 4.) Enter all 4 Scenario results into the Scenario Analysis Section below. 5.) Share your insights in the Discussion Thread 6.) Please note, week 3 DQ is setup so you will not see others' responses until yours is complete - 1 Scenario Analysis Section Hybrid Strategy Total cost = Per unit cost = Cost of Chase Strategy Total cost = Per unit cost Cost of Flexibility Strategy Total cost = Per unit cost Cost of Level Strategy Total cost = : Per unit cost
Step by Step Solution
There are 3 Steps involved in it

Get step-by-step solutions from verified subject matter experts