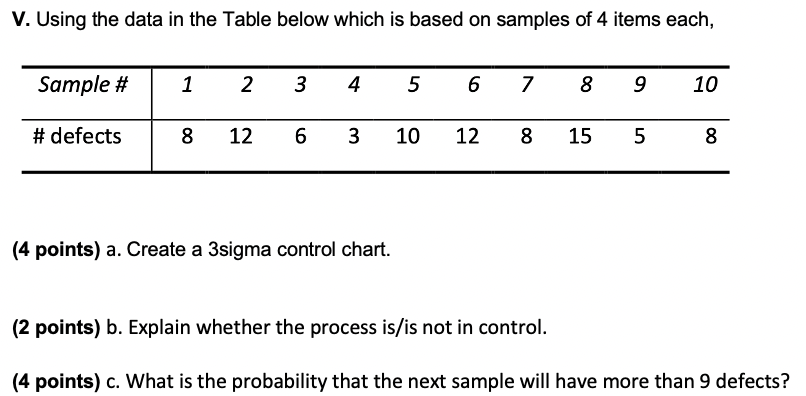
Question: V. Using the data in the Table below which is based on samples of 4 items each, Sample # 1 2 3 4 5 6

V. Using the data in the Table below which is

V. Using the data in the Table below which is based on samples of 4 items each, Sample # 1 2 3 4 5 6 7 8 9 10 # defects 8 00 12 6 3 10 12 00 8 15 5 00 8 (4 points) a. Create a 3sigma control chart. (2 points) b. Explain whether the process is/is not in control. (4 points) c. What is the probability that the next sample will have more than 9 defects

Step by Step Solution

There are 3 Steps involved in it

1 Expert Approved Answer
Step: 1 Unlock blur-text-image
Question Has Been Solved by an Expert!

Get step-by-step solutions from verified subject matter experts

Step: 2 Unlock
Step: 3 Unlock

Students Have Also Explored These Related General Management Questions!