

Question: We are making a p chart with variable sample sizes. We have decided to use Nave to establish our Control limits instead of calculating each
We are making a p chart with variable sample sizes.
We have decided to use Nave to establish our Control limits instead of calculating each individual control limit.
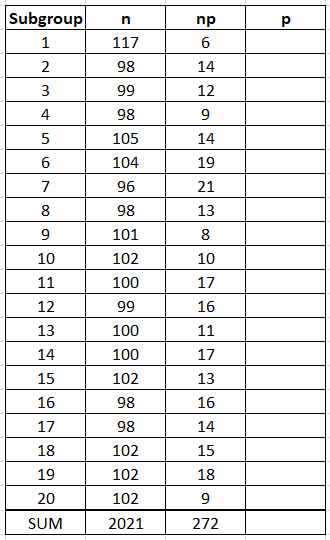
What is the value of Nave for this data?
0.135
101
7.43
13.6
show work
n p 117 Subgroup 1 2. 3 4 5 98 99 98 105 104 96 98 101 102 100 np 6 14 12 9 14 19 21 13 8 10 17 99 16 6 7 8 9 10 11 12 13 14 15 16 17 18 19 20 SUM 11 17 13 16 100 100 102 98 98 102 102 102 2021 14 15 18 9 272Step by Step Solution
There are 3 Steps involved in it
1 Expert Approved Answer
Step: 1 Unlock

Question Has Been Solved by an Expert!
Get step-by-step solutions from verified subject matter experts
Step: 2 Unlock
Step: 3 Unlock