

Question: what does below mentioned slide from tables work depicts. this image is from the visualization of global superstore using tableu software. what does it depicts.
what does below mentioned slide from tables work depicts. this image is from the visualization of global superstore using tableu software. what does it depicts.
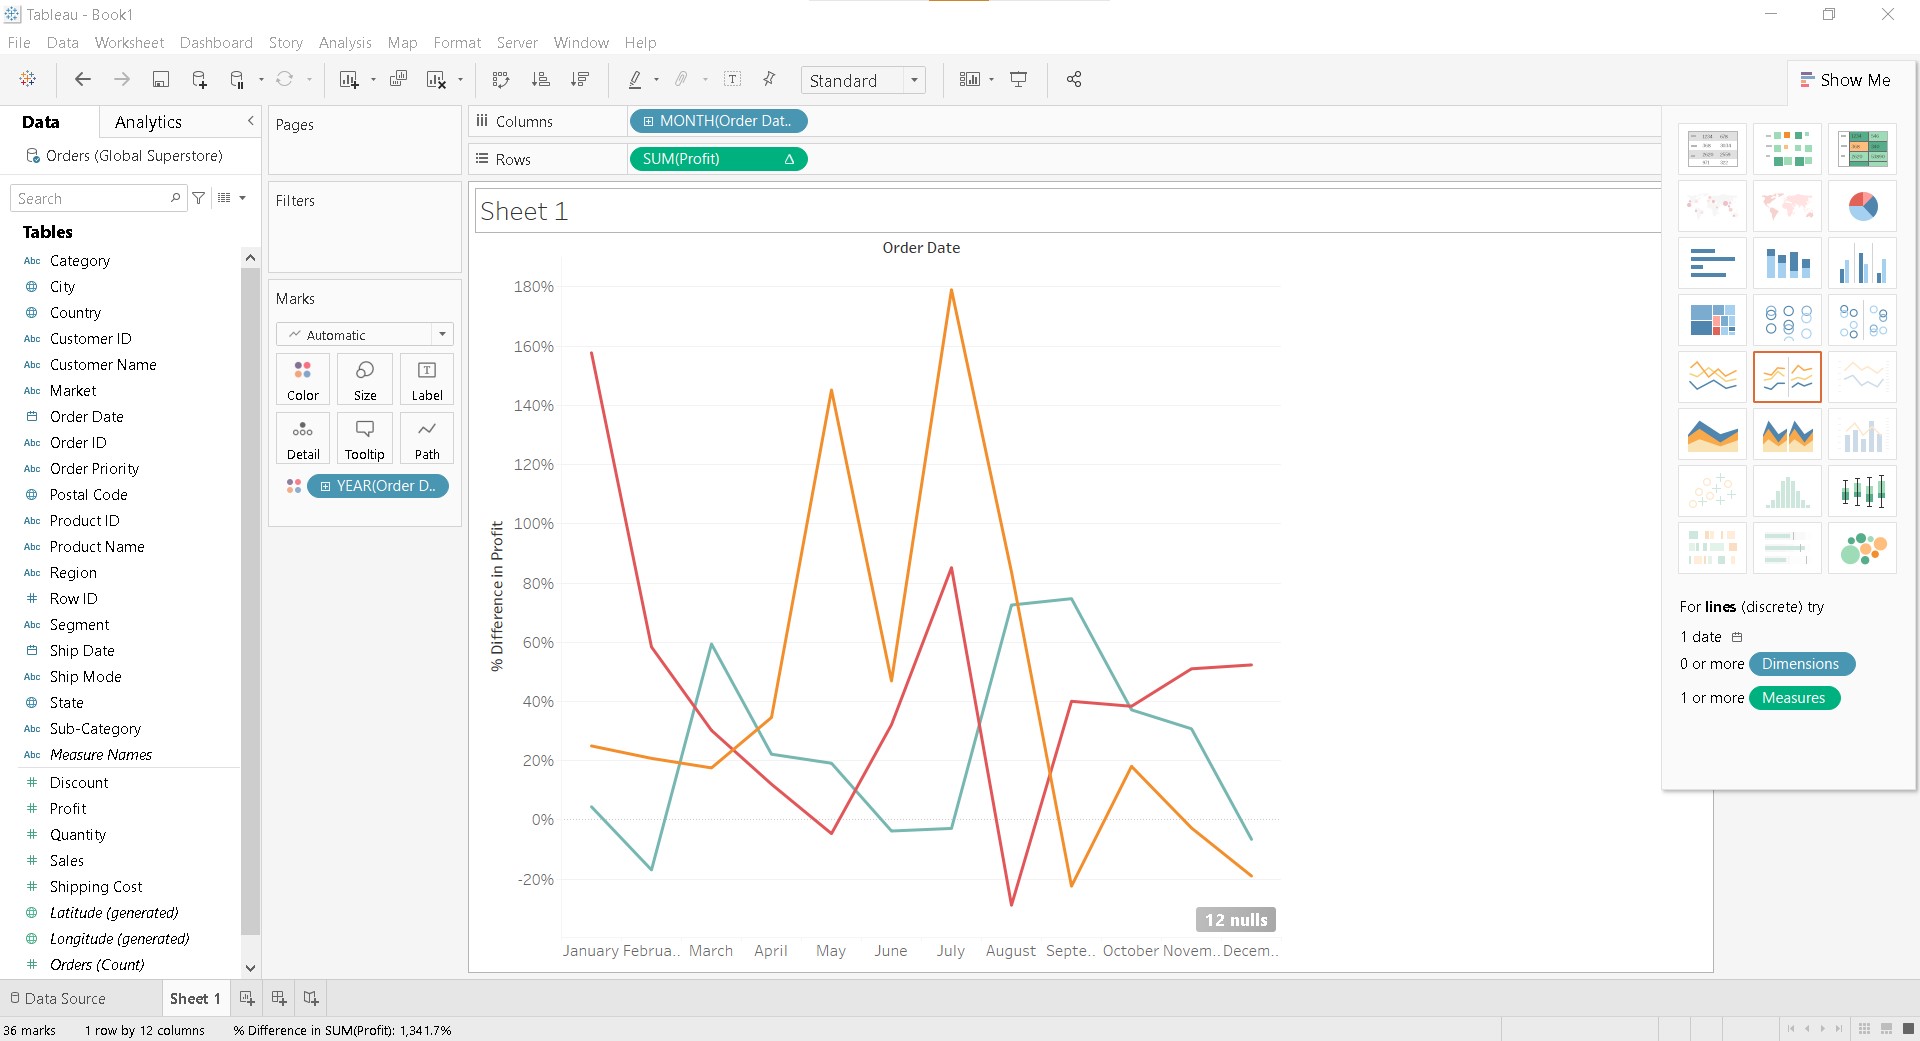
X Tableau - Book1 File Data Worksheet Dashboard Story Analysis Map Format Server Window Help Standard Show Me Data Analytics Pages iii Columns MONTH(Order Dat.. Orders (Global Superstore) Rows SUM(Profit) 4 Search Filters Sheet 1 Tables Order Date Category @ City 180% Marks @ Country O Abc Customer ID ~ Automatic 160% Abc Customer Name T W Abc Market Color Size Label 140% Order Date oo Abc Order ID Detai Tooltip Path Abc Order Priority 120% YEAR(Order D. @ Postal Code Abc Product ID 100% Abc Product Name Abc Region 30% # Row ID % Difference in Profit For lines (discrete) try Abc Segment 1 date 50% Ship Date 0 or more Dimensions Abc Ship Mode 1 or more Measures State 40% Abc Sub-Category Abc Measure Names 20% # Discount # Profit 0% # Quantity # Sales 20% # Shipping Cost Latitude (generated) 12 nulls @ Longitude (generated) January Februar. March April May June July August Septe.. October Novem. . Decem.. # Orders (Count) U Data Source Sheet 1 0 04 36 marks 1 row by 12 columns % Difference in SUM(Profit): 1,34 1.7%
Step by Step Solution
There are 3 Steps involved in it

Get step-by-step solutions from verified subject matter experts