

Question: What should replace the blank line in the following Python code to output the chart below? import numpy as np import pandas as pd import
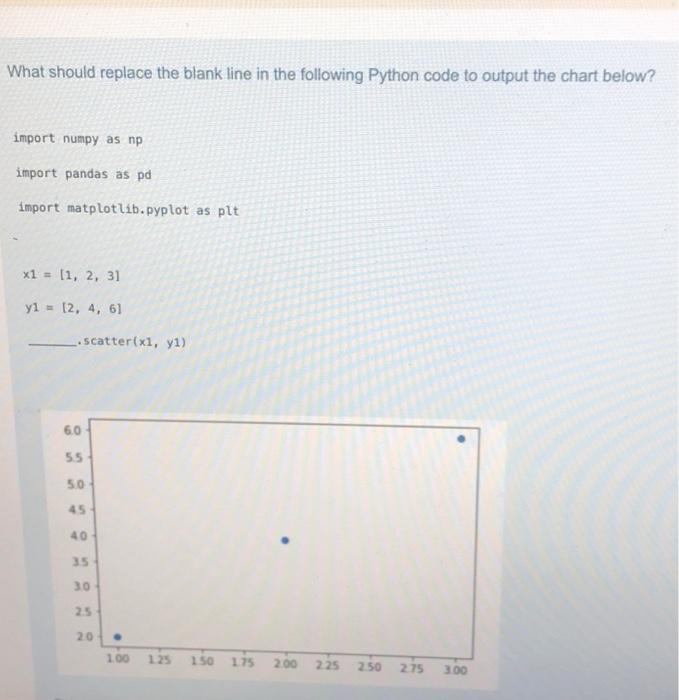
What should replace the blank line in the following Python code to output the chart below? import numpy as np import pandas as pd import matplotlib.pyplot as plt *1 = [1, 2, 3] y1 = 12, 4, 61 scatter(xi, y1) 6.0 55 50 45 40 35 30 25 20 1.00 125 150 175 200 225 2.50 275 300
Step by Step Solution
There are 3 Steps involved in it
1 Expert Approved Answer
Step: 1 Unlock

Question Has Been Solved by an Expert!
Get step-by-step solutions from verified subject matter experts
Step: 2 Unlock
Step: 3 Unlock