

Question: When we use a Hill plot to analyze ligand binding data, match each of the parameters to how you would find it on the plot.
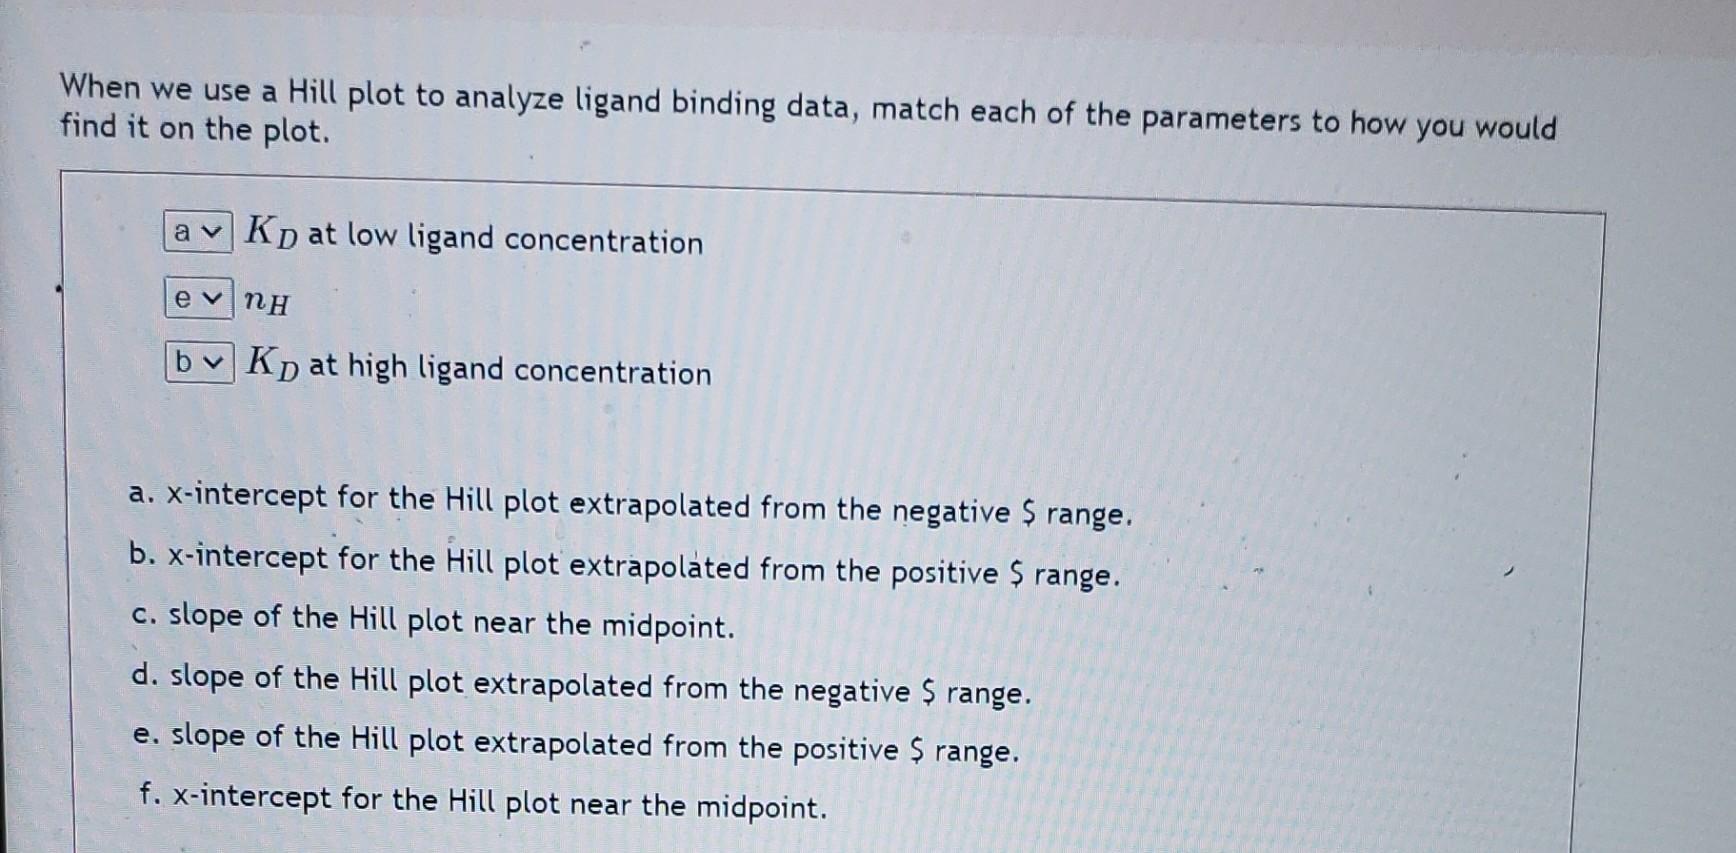
When we use a Hill plot to analyze ligand binding data, match each of the parameters to how you would find it on the plot. KD at low ligand concentration nH KD at high ligand concentration a. x-intercept for the Hill plot extrapolated from the negative $ range. b. x-intercept for the Hill plot extrapolated from the positive $ range. c. slope of the Hill plot near the midpoint. d. slope of the Hill plot extrapolated from the negative $ range. e. slope of the Hill plot extrapolated from the positive $ range. f. x-intercept for the Hill plot near the midpoint
Step by Step Solution
There are 3 Steps involved in it
1 Expert Approved Answer
Step: 1 Unlock

Question Has Been Solved by an Expert!
Get step-by-step solutions from verified subject matter experts
Step: 2 Unlock
Step: 3 Unlock