

Question: Which Gantt Chart is illustrating the convoy effect? Chart A: 0 Chart B: 0 Chart C: PI 0 PI 10 P2 PI 20 20
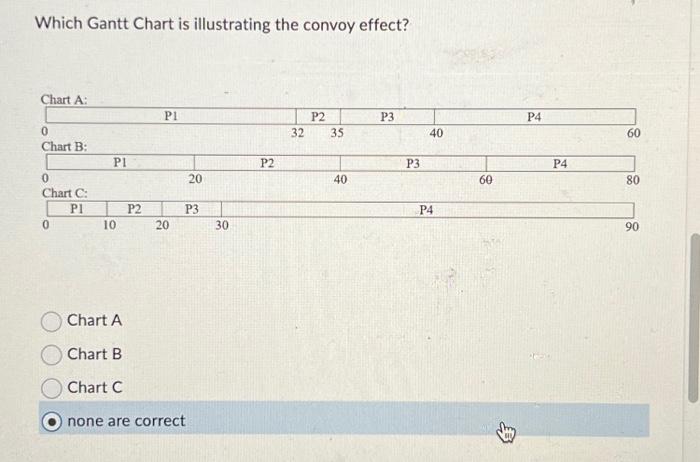
Which Gantt Chart is illustrating the convoy effect? Chart A: 0 Chart B: 0 Chart C: PI 0 PI 10 P2 PI 20 20 P3 Chart A Chart B Chart C none are correct 30 P2 P2 32 35 40 P3 P3 40 P4 60 P4 P4 60 80 90
Step by Step Solution
★★★★★
3.42 Rating (146 Votes )
There are 3 Steps involved in it
1 Expert Approved Answer
Step: 1 Unlock

The detailed answer for the above question is provided below The convoy effect refers to a situation ... View full answer
Question Has Been Solved by an Expert!
Get step-by-step solutions from verified subject matter experts
Step: 2 Unlock
Step: 3 Unlock