

Question: wirte the program in the MATLAB Description The following table gives the hourly temperature readings during a 12-hour period in suburb of New York City
 wirte the program in the MATLAB
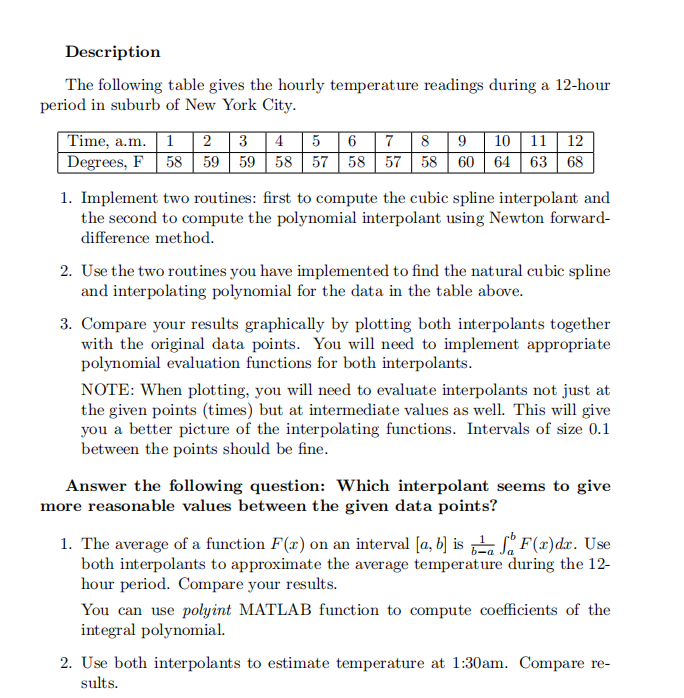
Description The following table gives the hourly temperature readings during a 12-hour period in suburb of New York City Time, a.m. 1 23 45678 9 10 11 1 Degrees, F585959585758575860 646368 1. Implement two routines: first to compute the cubic spline interpolant and the second to compute the polynomial interpolant using Newton forward- difference method 2. Use the two routines you have implemented to find the natural cubic spline and interpolating polynomial for the data in the table above. 3. Compare your results graphically by plotting both interpolants together with the original data points. You will need to implement appropriate polynomial evaluation functions for both interpolants NOTE: When plotting, you will need to evaluate interpolants not just at the given points (times) but at intermediate values as well. This will give you a better picture of the interpolating functions. Intervals of size 0.1 between the points should be fine Answer the following question: Which interpolant seems to give more reasonable values between the given data points? 1. The average of a function F(x) on an interval a, b is F()dr. Use both interpolants to approximate the average temperature during the 12- hour period. Compare your results. You can use polyint MATLAB function to compute coefficients of the integral polynomial. 2. Use both interpolants to estimate temperature at 1:30am. Compare re- sults. Description The following table gives the hourly temperature readings during a 12-hour period in suburb of New York City Time, a.m. 1 23 45678 9 10 11 1 Degrees, F585959585758575860 646368 1. Implement two routines: first to compute the cubic spline interpolant and the second to compute the polynomial interpolant using Newton forward- difference method 2. Use the two routines you have implemented to find the natural cubic spline and interpolating polynomial for the data in the table above. 3. Compare your results graphically by plotting both interpolants together with the original data points. You will need to implement appropriate polynomial evaluation functions for both interpolants NOTE: When plotting, you will need to evaluate interpolants not just at the given points (times) but at intermediate values as well. This will give you a better picture of the interpolating functions. Intervals of size 0.1 between the points should be fine Answer the following question: Which interpolant seems to give more reasonable values between the given data points? 1. The average of a function F(x) on an interval a, b is F()dr. Use both interpolants to approximate the average temperature during the 12- hour period. Compare your results. You can use polyint MATLAB function to compute coefficients of the integral polynomial. 2. Use both interpolants to estimate temperature at 1:30am. Compare re- sults
Step by Step Solution
There are 3 Steps involved in it

Get step-by-step solutions from verified subject matter experts