

Question: With the data attached: 1. Draw a project network. 2. What is the normal project cost? 3. What is the critical path 4. What would
With the data attached: 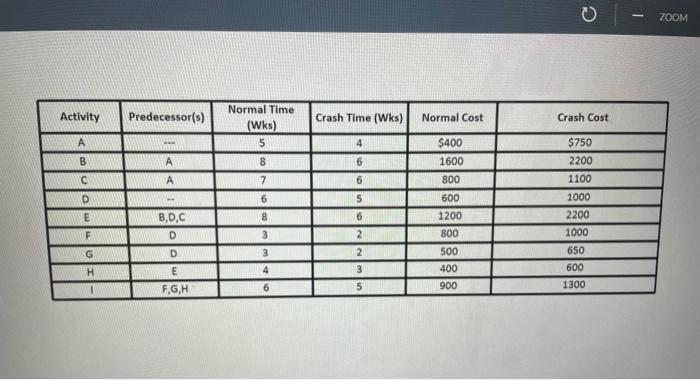
1. Draw a project network.
2. What is the normal project cost?
3. What is the critical path
4. What would be the total cost of this project if need to crazh it by 1 week?
Please if possible explain as this is to help me learn.
\begin{tabular}{|c|c|c|c|c|c|} \hline Activity & Predecessor(s) & NormalTime(Wks) & Crash Time (Wks) & Normal Cost & Crash Cost \\ \hline A & & 5 & 4 & $400 & $750 \\ \hline B & A & 8 & 6 & 1600 & 2200 \\ \hline C & A & 7 & 6 & 800 & 1100 \\ \hline D & & 6 & 5 & 600 & 1000 \\ \hline E & B,D,C & 8 & 6 & 1200 & 2200 \\ \hline F & D & 3 & 2 & 800 & 1000 \\ \hline G & D & 3 & 2 & 500 & 650 \\ \hline H & E & 4 & 3 & 400 & 600 \\ \hline I & F,G,H & 6 & 5 & 900 & 1300 \\ \hline \end{tabular}
Step by Step Solution
There are 3 Steps involved in it
1 Expert Approved Answer
Step: 1 Unlock

Question Has Been Solved by an Expert!
Get step-by-step solutions from verified subject matter experts
Step: 2 Unlock
Step: 3 Unlock