

Question: With the gasoline time series data from the given table, show the exponential smoothing forecasts using = 0.1. Applying the MSE measure of forecast accuracy,
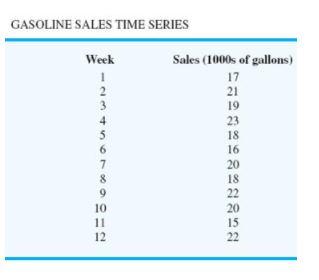
With the gasoline time series data from the given table, show the exponential smoothing forecasts using = 0.1.
- Applying the MSE measure of forecast accuracy, would you prefer a smoothing constant of = 0.1 or = 0.2 for the gasoline sales time series? Do not round your interim computations and round your final answers to three decimal places.
Prefer:= 0.1 = 0.2 MSE fill in the blank 1 fill in the blank 2 - Are the results the same if you apply MAE as the measure of accuracy? Do not round your interim computations and round your final answers to three decimal places.
Prefer:= 0.1 = 0.2 MAE fill in the blank 4 fill in the blank 5 - What are the results if MAPE is used? Do not round your interim computations and round your final answers to two decimal places.
Prefer:= 0.1 = 0.2 MAPE fill in the blank 7 % fill in the blank 8 %
Step by Step Solution
There are 3 Steps involved in it
1 Expert Approved Answer
Step: 1 Unlock

Question Has Been Solved by an Expert!
Get step-by-step solutions from verified subject matter experts
Step: 2 Unlock
Step: 3 Unlock