

Question: Would you create X - bar and R Charts for this data or X - bar and S Charts? What is the centerline for the
Would you create X bar and R Charts for this data or Xbar and S Charts?
What is the centerline for the corresponding Xbar chart?
What is the UCL for the corresponding Xbar chart?
What is the LCL for the corresponding Xbar chart?
What is the centerline for the corresponding or chart?
What is the UCL for the corresponding R or S chart?
What is the LCL for the corresponding R or chart?
Is this process under control? Why or Why not?
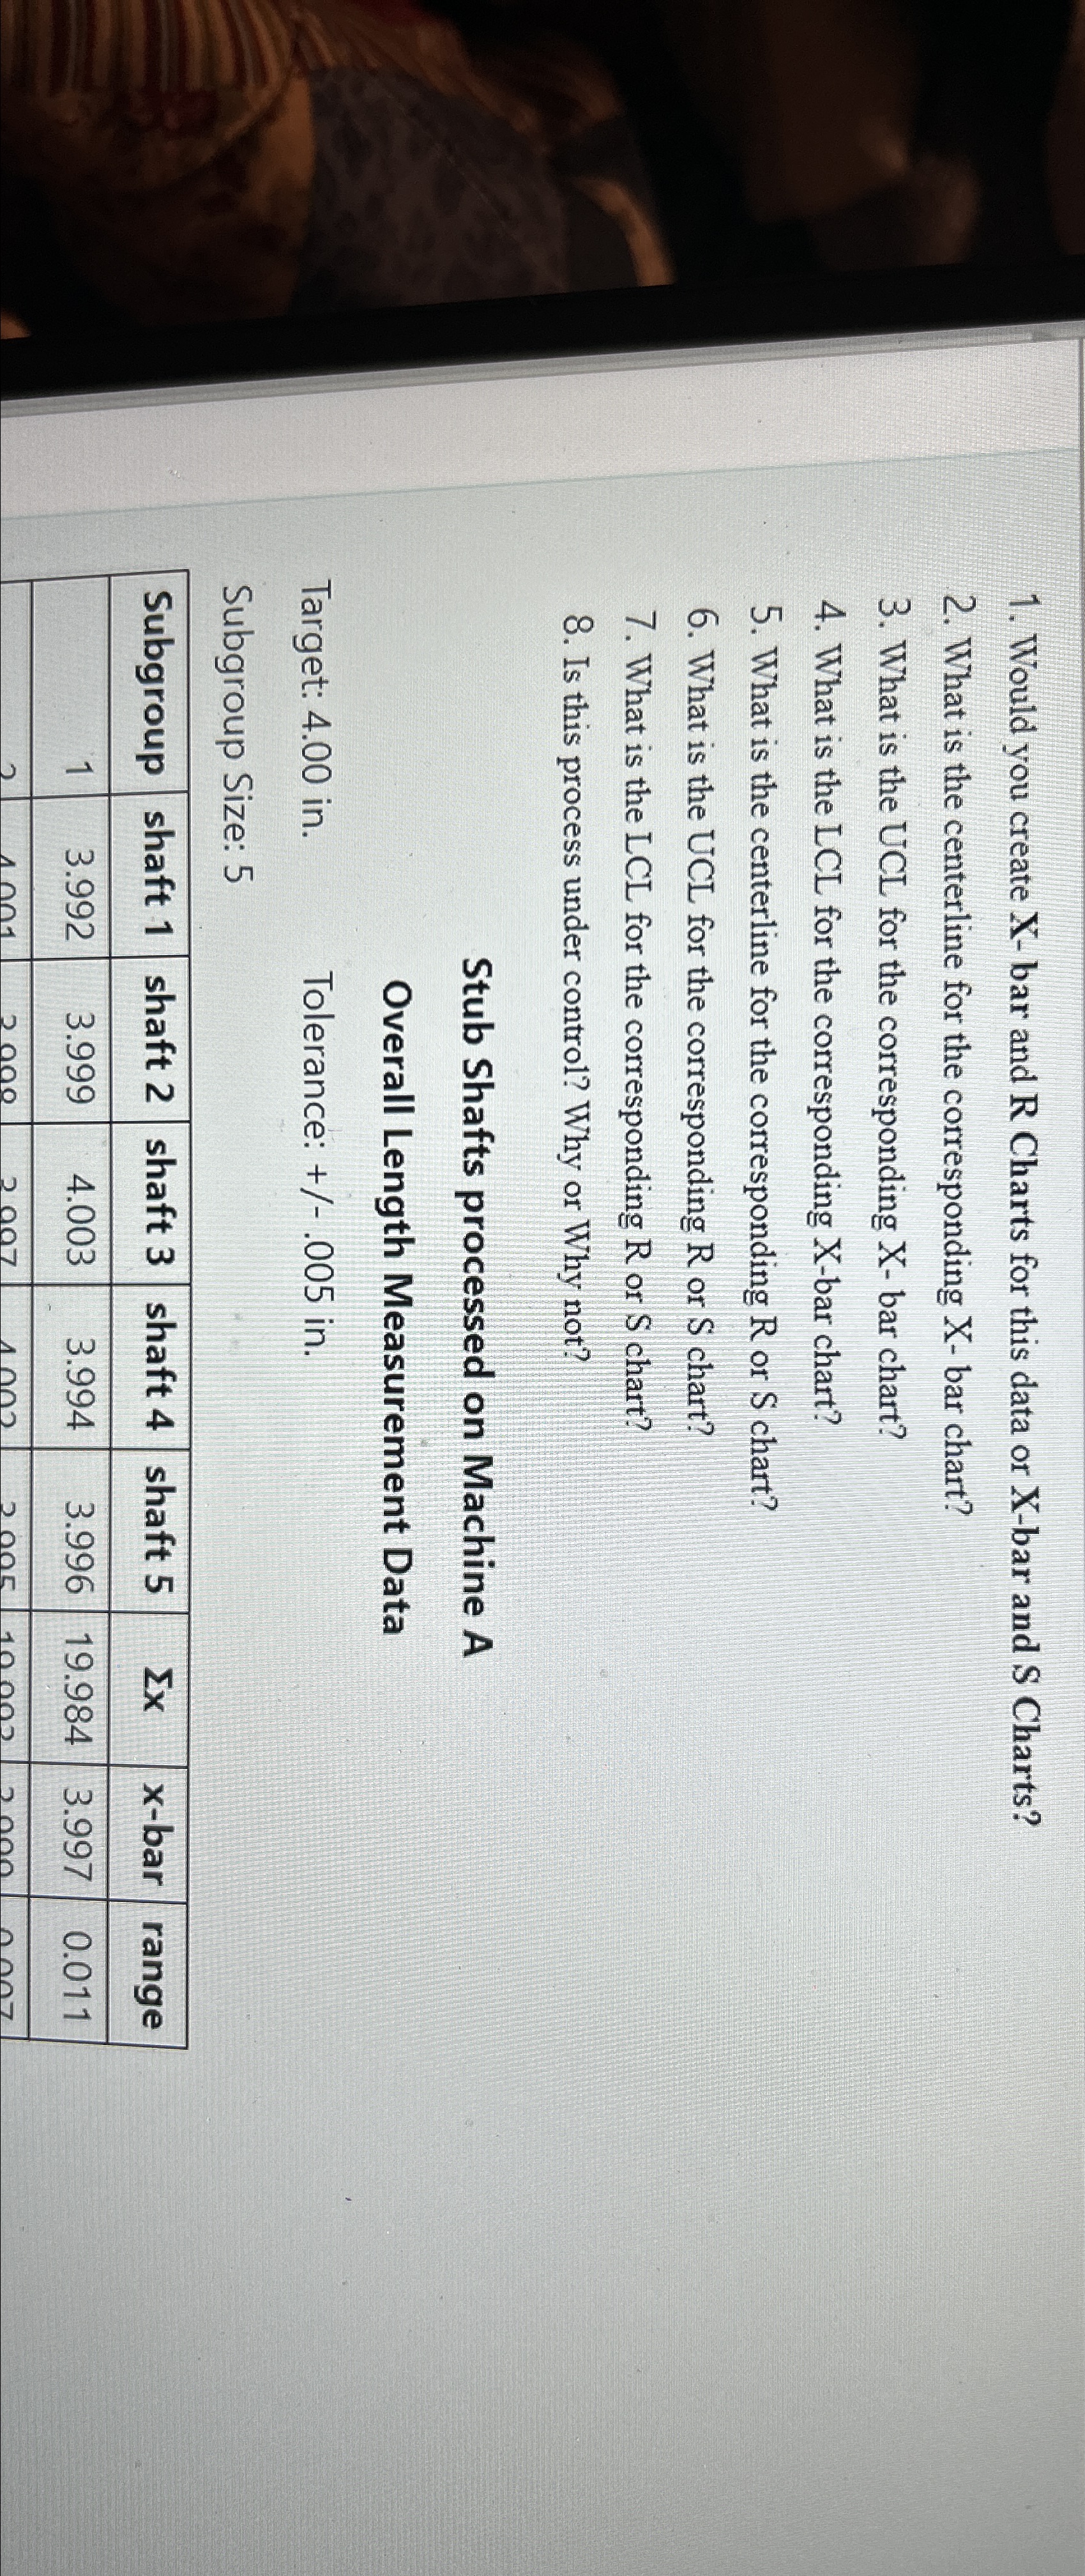
Stub Shafts processed on Machine A
Overall Length Measurement Data
Target: in Tolerance: in
Subgroup Size:
tableSubgroupshaft shaft shaft shaft shaft range
Step by Step Solution
There are 3 Steps involved in it
1 Expert Approved Answer
Step: 1 Unlock

Question Has Been Solved by an Expert!
Get step-by-step solutions from verified subject matter experts
Step: 2 Unlock
Step: 3 Unlock