

Question: Write a script that calls your function myLinReg from Homework 4 to solve problem 3. best fit values a and B. In a single graph,

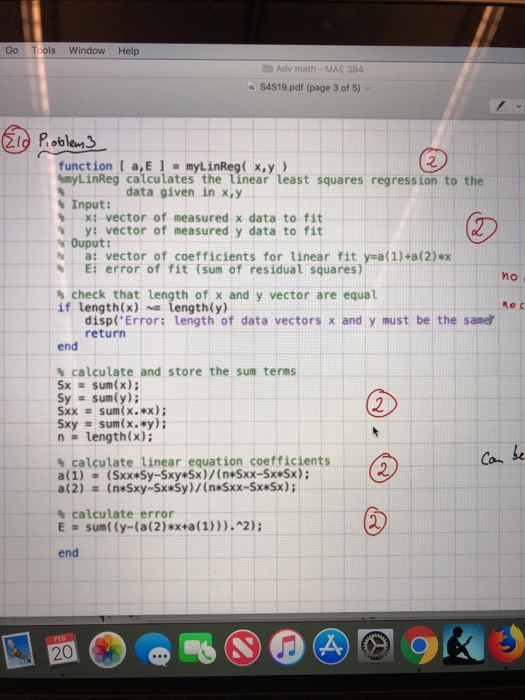

Write a script that calls your function myLinReg from Homework 4 to solve problem 3. best fit values a and B. In a single graph, plot the data points from problem 3 together with the best fit model using a range for t of 1 t 5 and i 3. Report the Go ToolsWindow Help Adv math-MAE 384 s S4S19.pdf (page 3 of 5) function [a,E1-myLinReg( x,y) 2. hmyL inReg calculates the tinear Least squares regress ion to the data given in x,y % Input: x: vector of measured x data to fit y: vector of measured y data to fit Ouput: a: vector of coefficients for linear fit y-a(1)+a(2)*x s gures % , E: error of fit (sum of residual squa res) ho %check that length of x and y vector are equal if length(x) length(y) disp( Error: length of data vectors x and y must be the same return end % calculate and store the sum terms Sxsum(x) Sy sum(y) 2 Sxy = sum( x.*y); n = length(x); be % calculate linear equation coefficients a(2) (n Sxy-Sx Sy)/(n Sxx-Sx*Sx); s calculate error E sum( (y-(a(2)*x+a(1))),"2); end 20 2
Step by Step Solution
There are 3 Steps involved in it

Get step-by-step solutions from verified subject matter experts