

Question: Write a spreadsheet that uses the Hardy Cross technique to perform analysis of pipe flow network given below Figure represents the water distribution network in
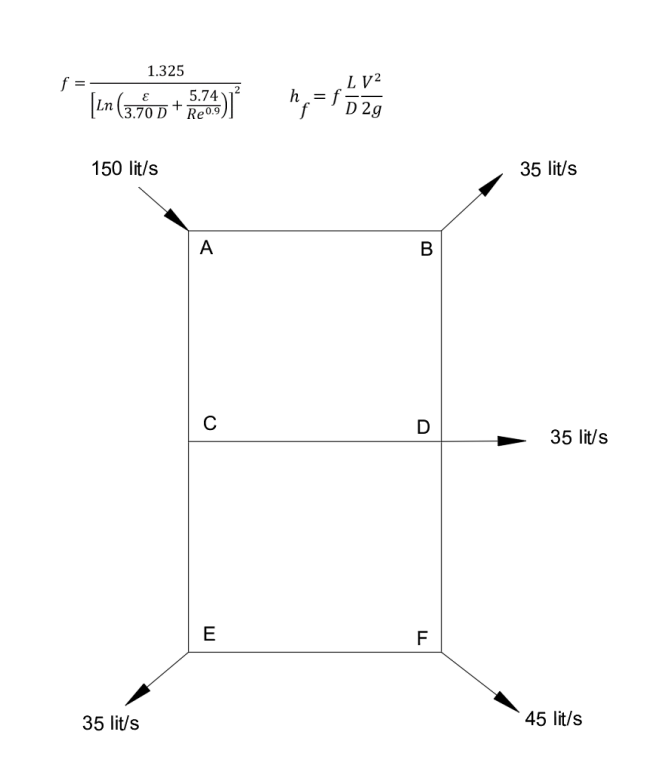
Write a spreadsheet that uses the Hardy Cross technique to perform analysis of pipe flow network given below Figure represents the water distribution network in a small industrial park. The supply of m s of water at C enters the system at A Manufacturing plants draw off the indicated flow at points C E F G H and L Determine the flow in each pipe in the system. Design the water distribution network given below by using the HardyCross
method. Use the DarcyWeisbach equation for head losses.
Select a city from the map Google Earth Pro is highly recommended Read the
length and elevation of points from the map.
Minimum and maximum operative head are and of water respectively.
Write a report and explain what you did and present the results of your design.
amm a is the summation of two digits from the right end of your student
number eg if your student number is
Step by Step Solution
There are 3 Steps involved in it
1 Expert Approved Answer
Step: 1 Unlock

Question Has Been Solved by an Expert!
Get step-by-step solutions from verified subject matter experts
Step: 2 Unlock
Step: 3 Unlock