

Question: Write probability analysis for this company 2017 2018 2019 3 Profitability Ratios: 4 5 Return on Equity 6 Profit avail to owners/ 7 Average Equity
Write probability analysis for this company
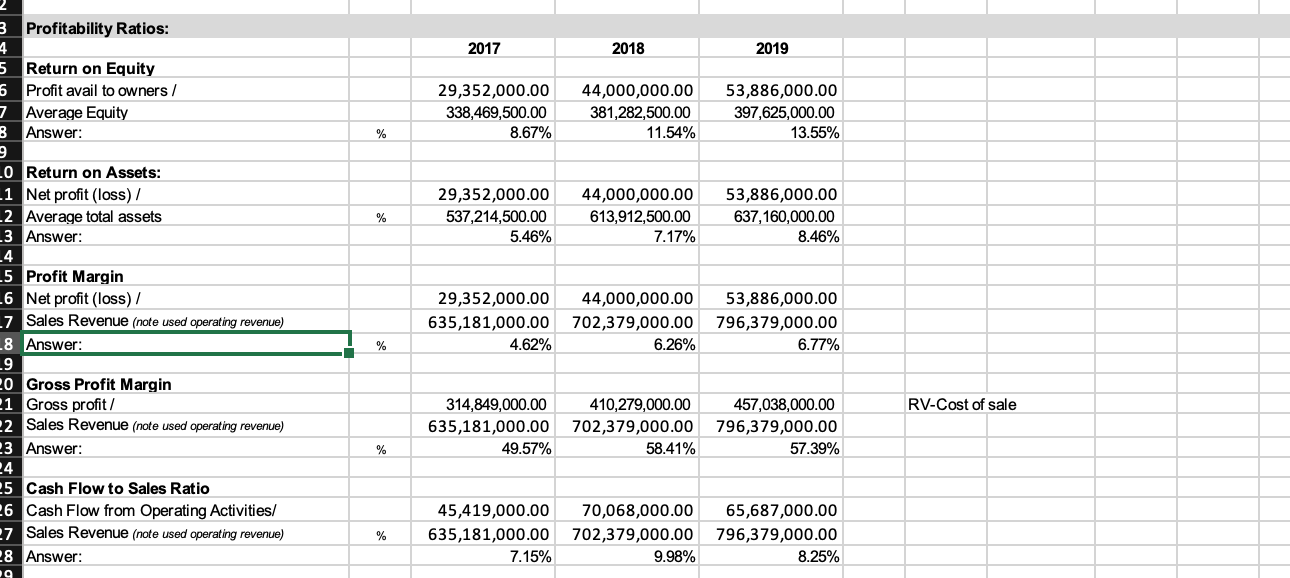
2017 2018 2019 3 Profitability Ratios: 4 5 Return on Equity 6 Profit avail to owners/ 7 Average Equity B Answer: 29,352,000.00 338,469,500.00 8.67% 44,000,000.00 381,282,500.00 11.54% 53,886,000.00 397,625,000.00 13.55% % % 29,352,000.00 537,214,500.00 5.46% 44,000,000.00 613,912,500.00 7.17% 53,886,000.00 637,160,000.00 8.46% 29,352,000.00 635,181,000.00 4.62% 44,000,000.00 702,379,000.00 6.26% 53,886,000.00 796,379,000.00 6.77% % .0 Return on Assets: -1 Net profit (loss) / .2 Average total assets 23 Answer: 4 5 Profit Margin -6 Net profit (loss) / -7 Sales Revenue (note used operating revenue) -8 Answer: 9 20 Gross Profit Margin 21 Gross profit/ 22 Sales Revenue (note used operating revenue) 23 Answer: 24 5 Cash Flow to Sales Ratio 6 Cash Flow from Operating Activities/ 27 Sales Revenue (note used operating revenue) 28 Answer: 19 RV-Cost of sale 314,849,000.00 410,279,000.00 635,181,000.00 702,379,000.00 49.57% 58.41% 457,038,000.00 796,379,000.00 57.39% % % 45,419,000.00 70,068,000.00 65,687,000.00 635,181,000.00 702,379,000.00 796,379,000.00 7.15% 9.98% 8.25%
Step by Step Solution
There are 3 Steps involved in it

Get step-by-step solutions from verified subject matter experts