

Question: write the scientific story as shown by the data presented in fig2. No more than 4 sentences. which interspecific cross showed the highest fruit set?
- write the scientific story as shown by the data presented in fig2. No more than 4 sentences.
- which interspecific cross showed the highest fruit set? Which plant was the pollen donor and which plant was the pollen recipient?
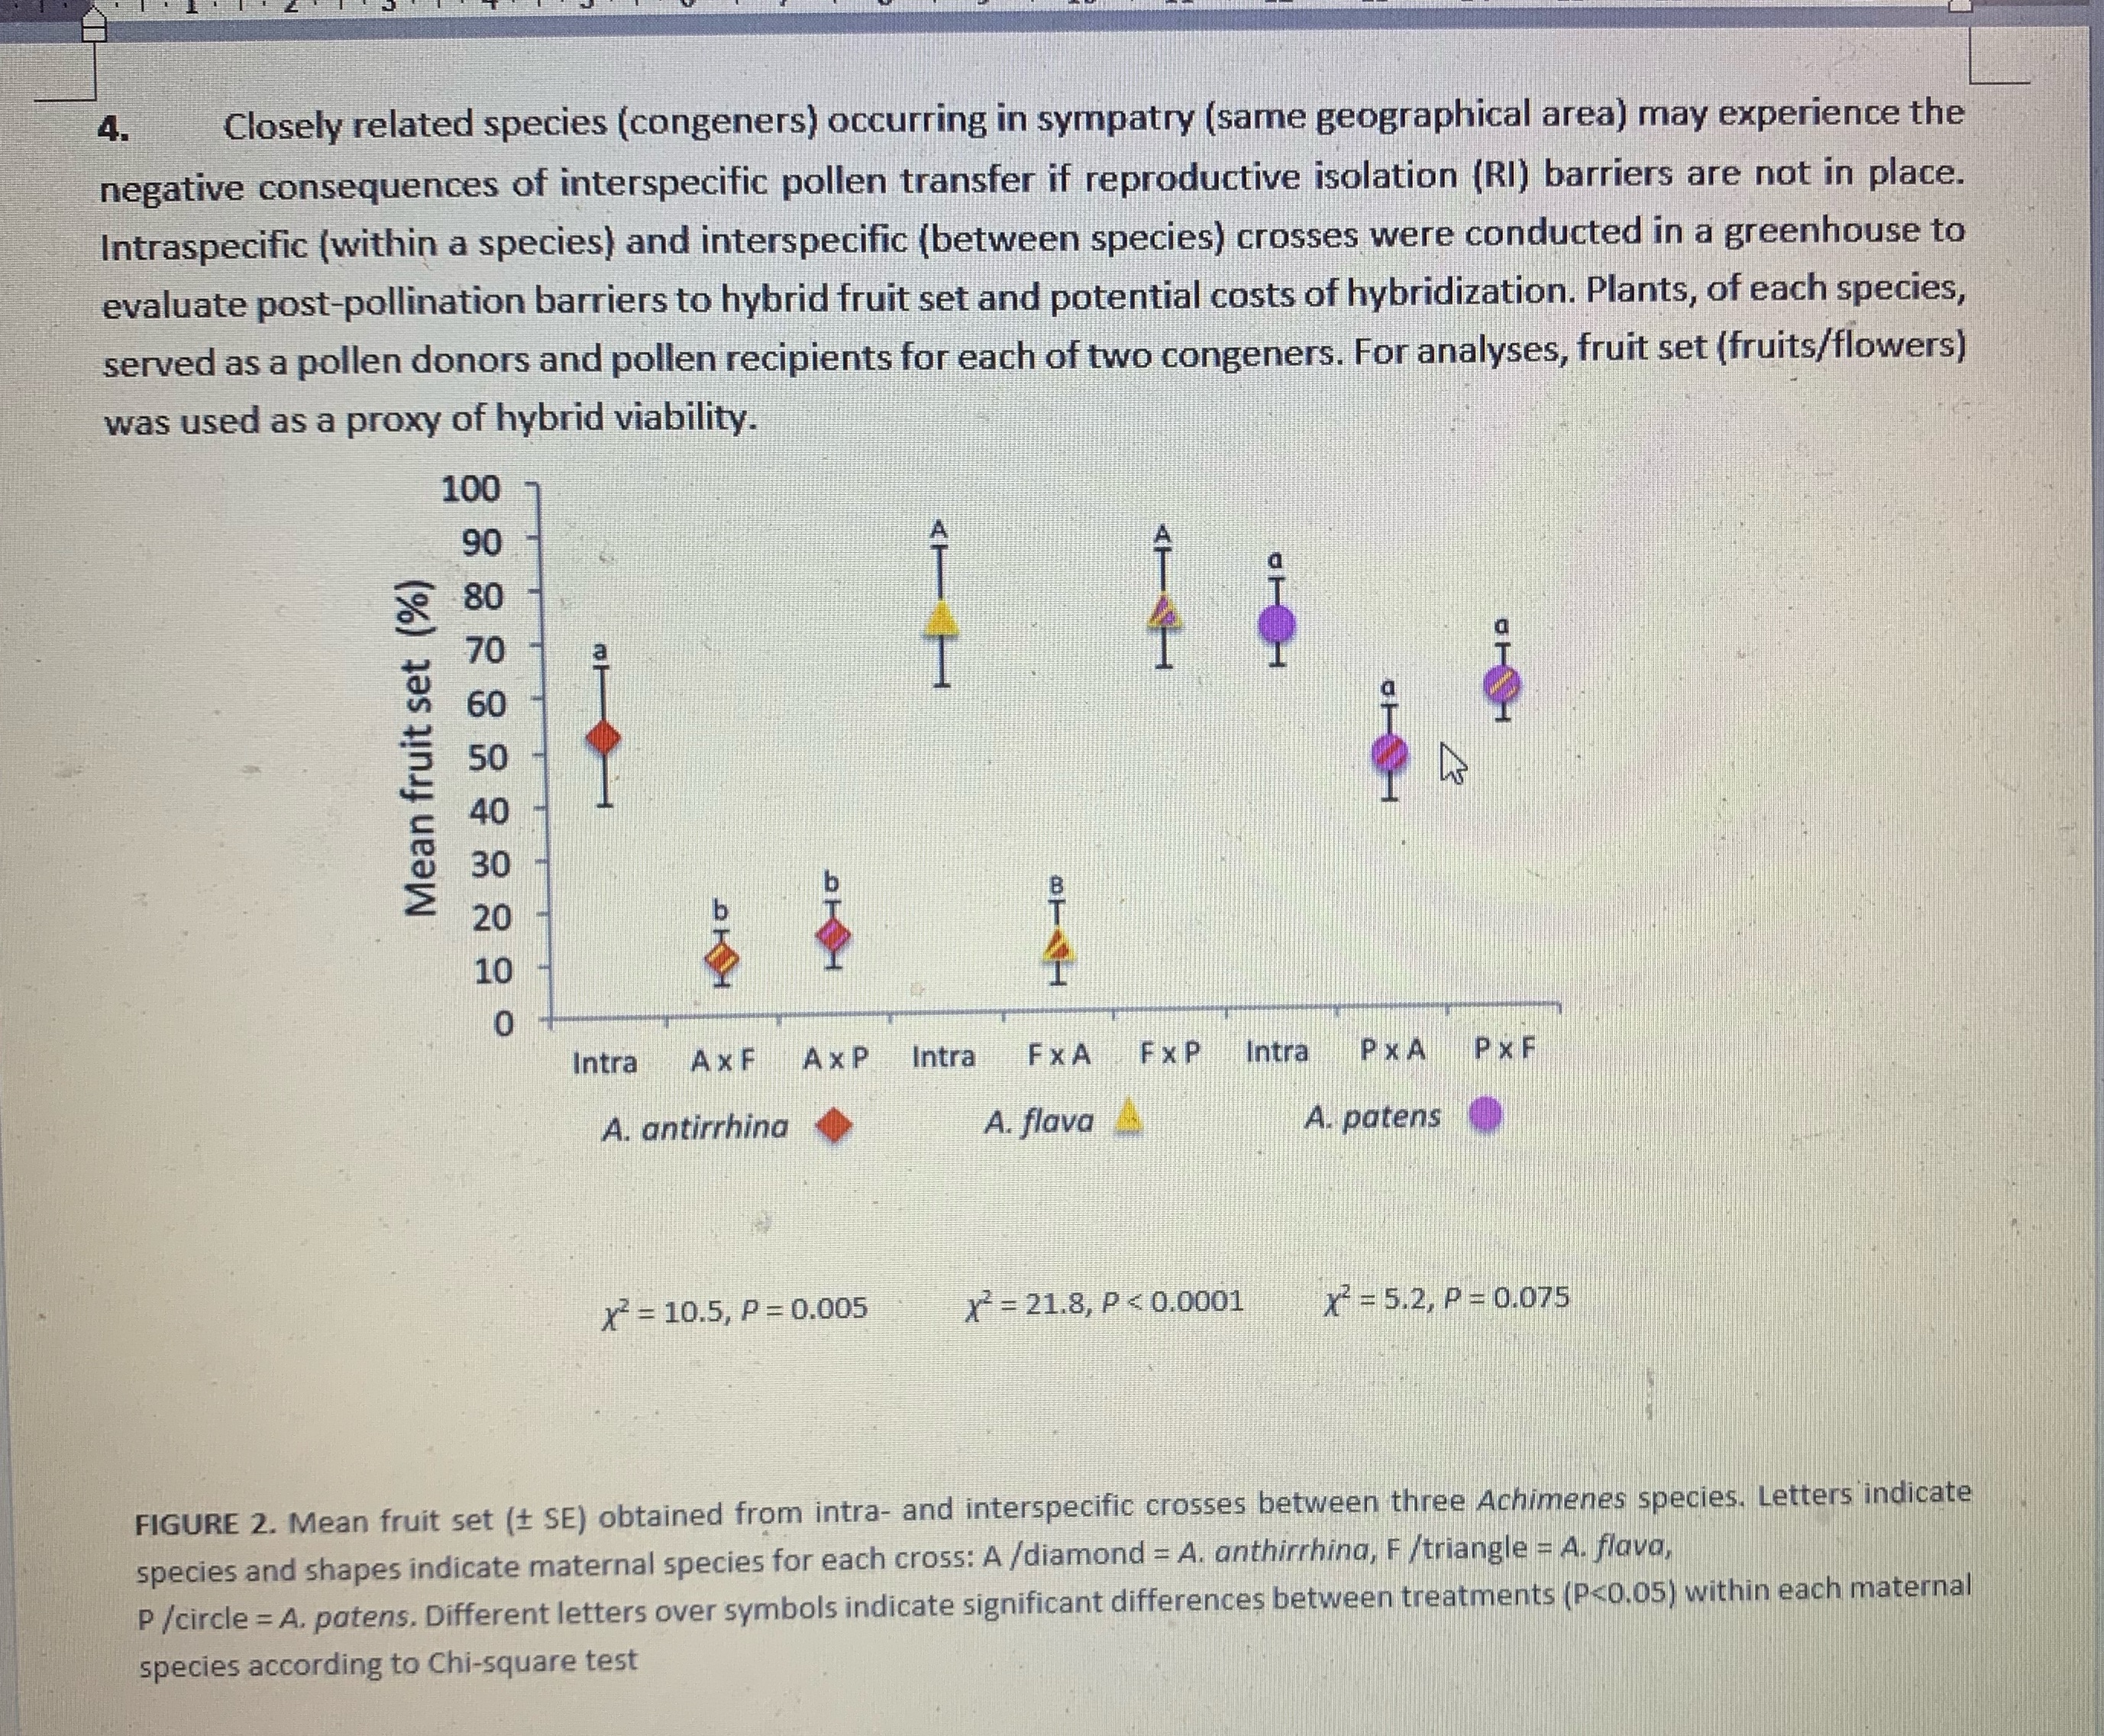
4. Closely related species (congeners) occurring in sympatry (same geographical area) may experience the negative consequences of interspecific pollen transfer if reproductive isolation (RI) barriers are not in place. Intraspecific (within a species) and interspecific (between species) crosses were conducted in a greenhouse to evaluate post-pollination barriers to hybrid fruit set and potential costs of hybridization. Plants, of each species, served as a pollen donors and pollen recipients for each of two congeners. For analyses, fruit set (fruits/flowers) was used as a proxy of hybrid viability. 100 90 Mean fruit set (%) Intra AxF AXP Intra FXA FXP Intra PXA Px F A. antirrhina A. flava A. patens x? = 10.5, P = 0.005 X = 21.8, P
Step by Step Solution
There are 3 Steps involved in it

Get step-by-step solutions from verified subject matter experts