

Question: X + Week 4: Interactive Assessment X | M McGraw Hill - Connect Week 4: Interactive Assessment X G a https:/ewconnect.mheducation.com Mc Graw connect Operating
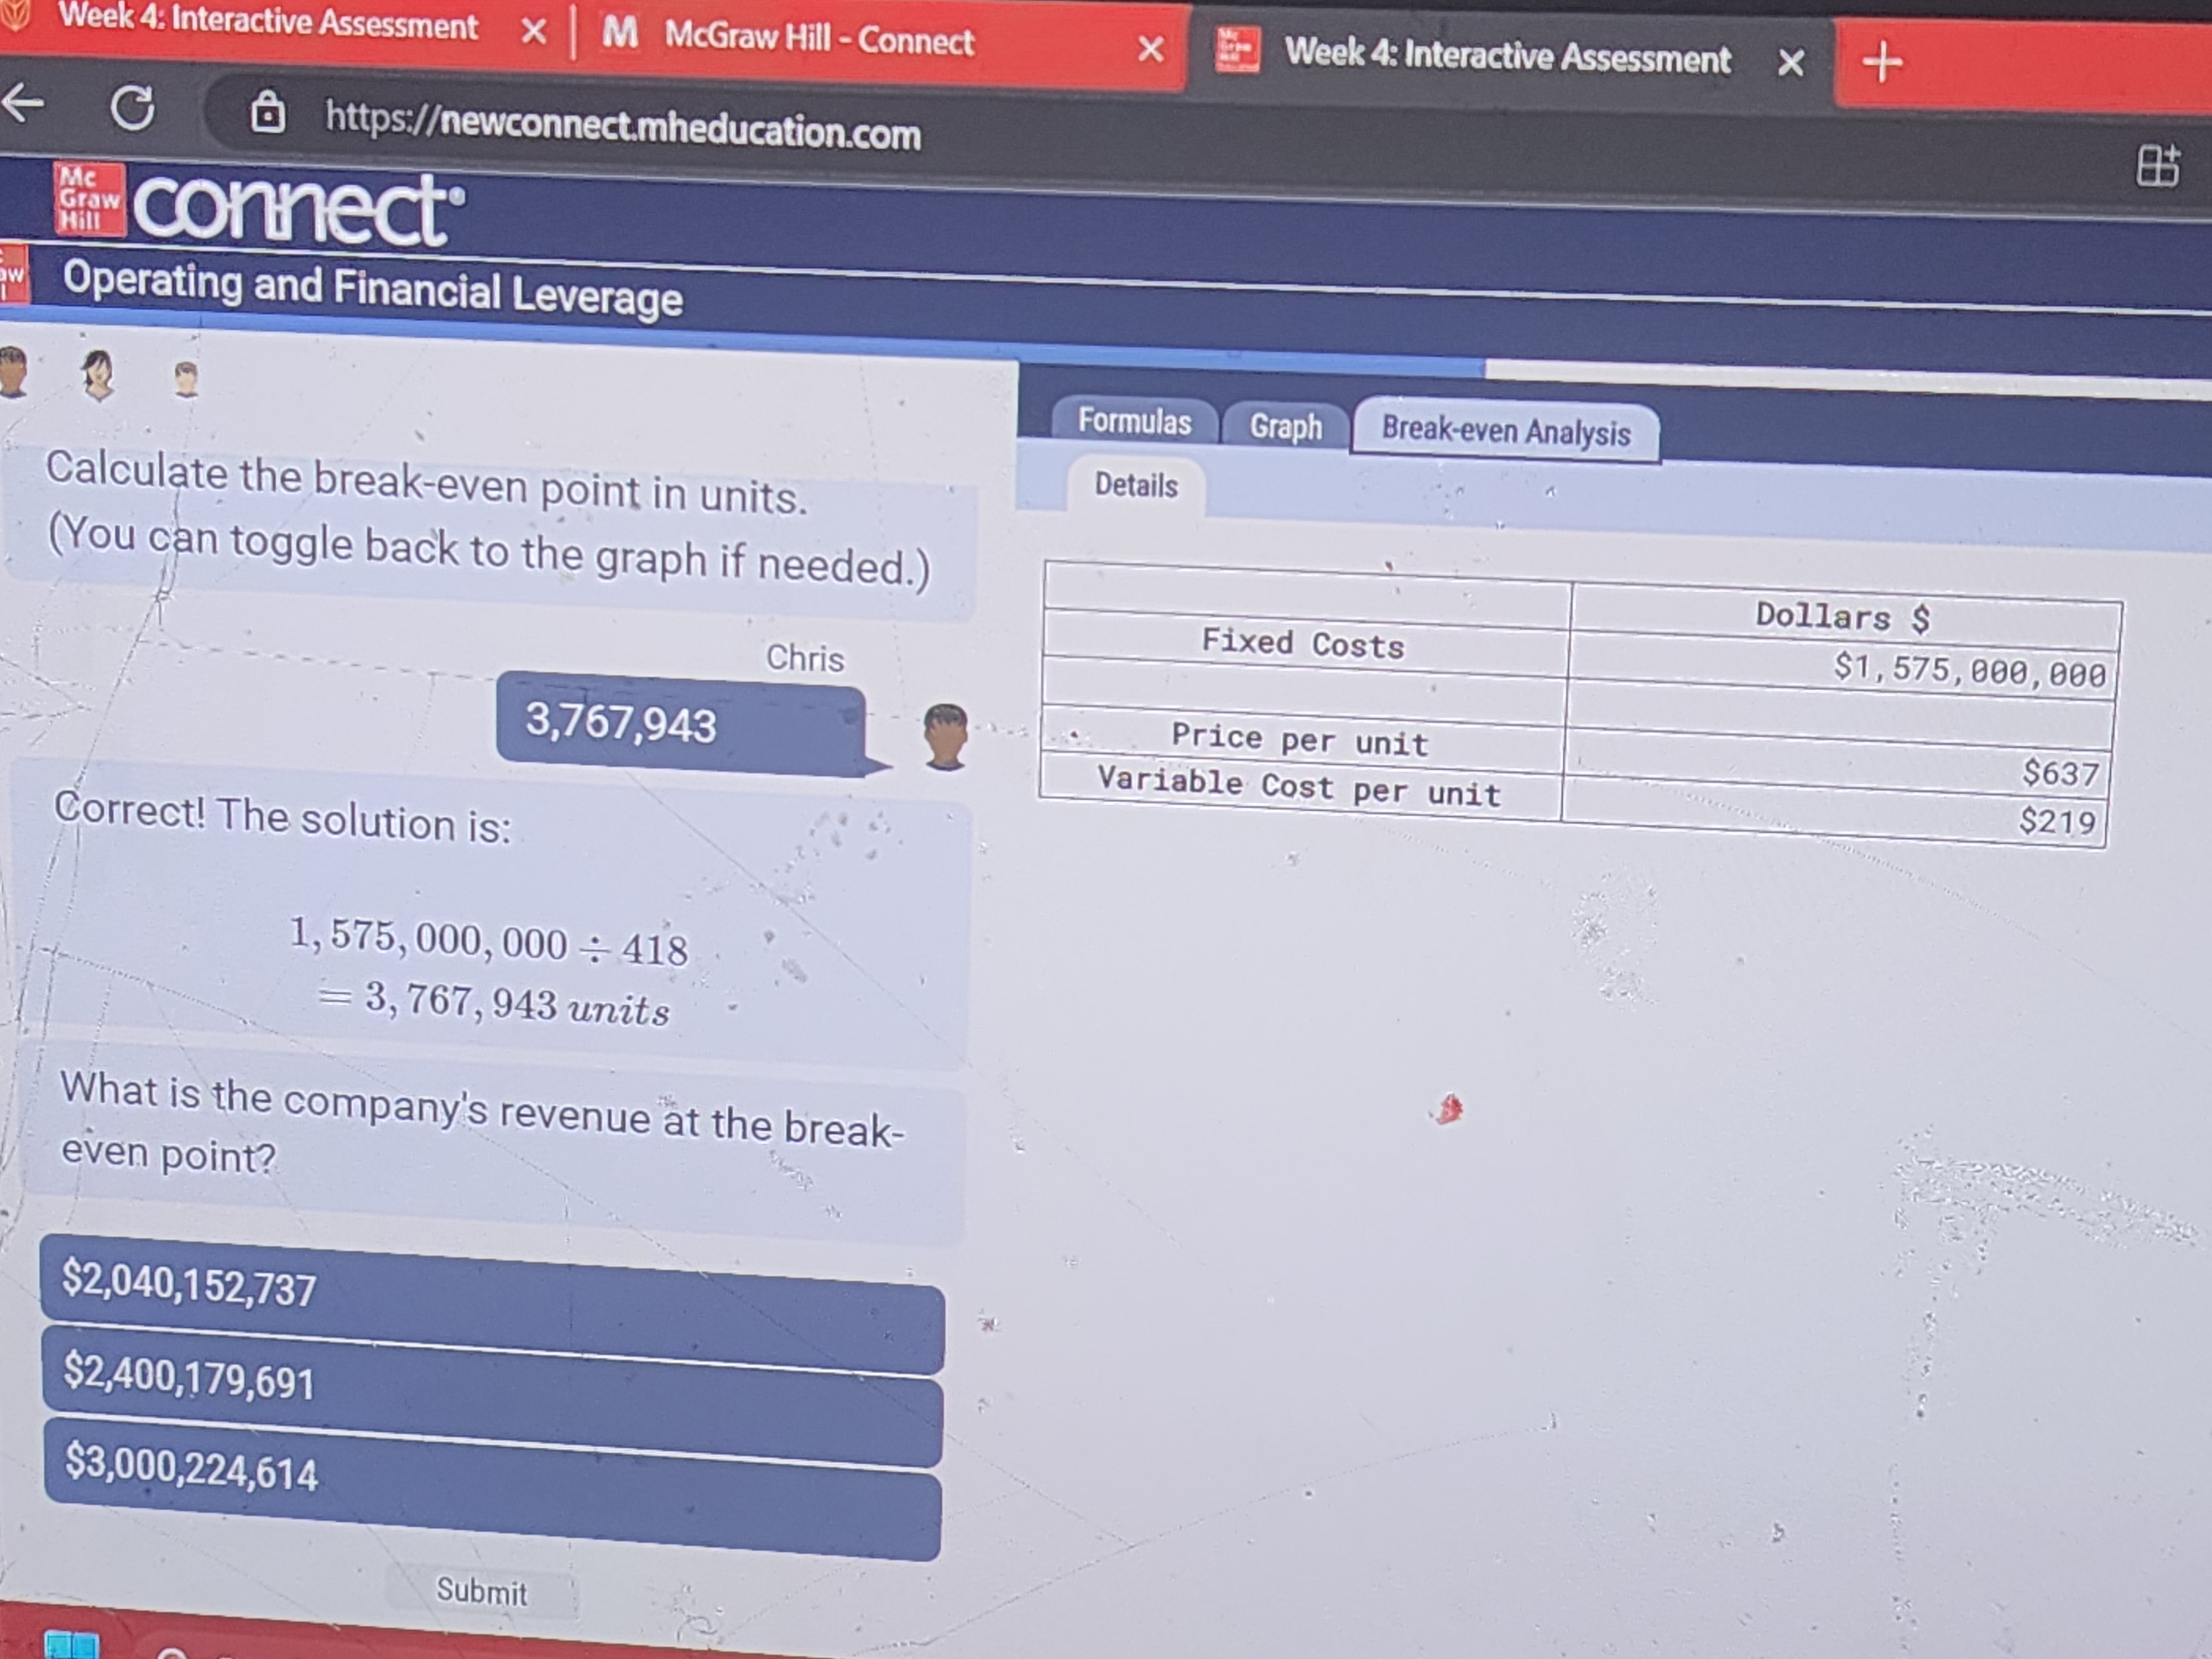
X + Week 4: Interactive Assessment X | M McGraw Hill - Connect Week 4: Interactive Assessment X G a https:/ewconnect.mheducation.com Mc Graw connect Operating and Financial Leverage Formulas Graph Break-even Analysis Details Calculate the break-even point in units. (You can toggle back to the graph if needed.) Dollars $ Fixed Costs $1, 575, 000, 000 Chris 3,767,943 Price per unit $637 Variable Cost per unit $219 Correct! The solution is: 1, 575, 000, 000 : 418 = 3, 767, 943 units What is the company's revenue at the break- even point? $2,040,152,737 $2,400,179,691 $3,000,224,614 Submit
Step by Step Solution
There are 3 Steps involved in it
1 Expert Approved Answer
Step: 1 Unlock

Question Has Been Solved by an Expert!
Get step-by-step solutions from verified subject matter experts
Step: 2 Unlock
Step: 3 Unlock