

Question: ( X-bar and s charts) For a manufacturing process, we take M=20 samples of sample size n=4 each. The sums of M=20 sample means (Xi)
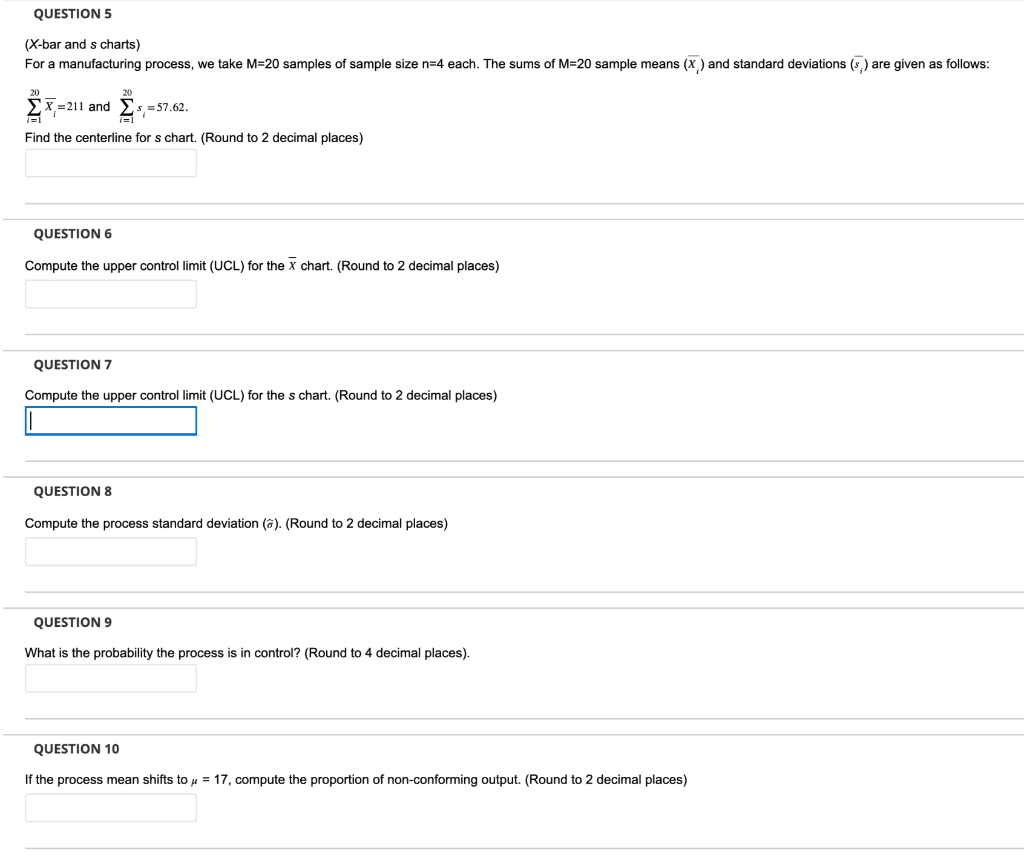
( X-bar and s charts) For a manufacturing process, we take M=20 samples of sample size n=4 each. The sums of M=20 sample means (Xi) and standard deviations (si) are given as follows: i=120Xi=211 and i=120si=57.62. Find the centerline for s chart. (Round to 2 decimal places) QUESTION 6 Compute the upper control limit (UCL) for the X chart. (Round to 2 decimal places) QUESTION 7 Compute the upper control limit (UCL) for the s chart. (Round to 2 decimal places) QUESTION 8 Compute the process standard deviation ( ). (Round to 2 decimal places) QUESTION 9 What is the probability the process is in control? (Round to 4 decimal places). QUESTION 10 If the process mean shifts to =17, compute the proportion of non-conforming output. (Round to 2 decimal places)
Step by Step Solution
There are 3 Steps involved in it

Get step-by-step solutions from verified subject matter experts