

Question: xy Plotting function THREE-DIMENSIONAL PLOTS PRACTICE Create the surface plot and a contour plot of the function Create a surface plot and a contour plot
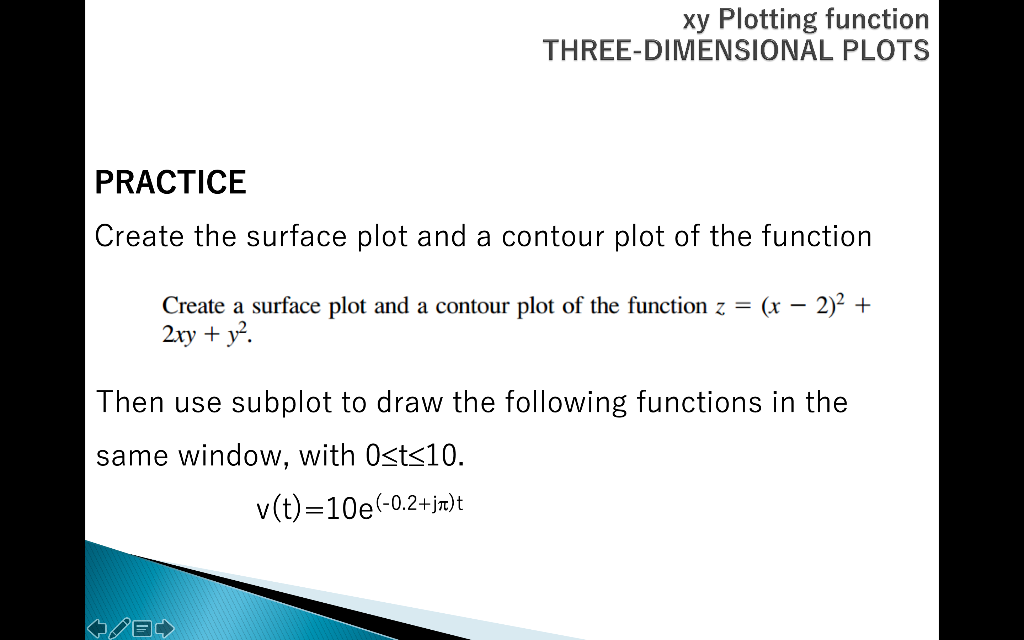
xy Plotting function THREE-DIMENSIONAL PLOTS PRACTICE Create the surface plot and a contour plot of the function Create a surface plot and a contour plot of the function z = (x 2)2 + 2xy + y2 Then use subplot to draw the following functions in the same window, with Osts10. v(t)=10e(-0.2+jx)
Step by Step Solution
There are 3 Steps involved in it
1 Expert Approved Answer
Step: 1 Unlock

Question Has Been Solved by an Expert!
Get step-by-step solutions from verified subject matter experts
Step: 2 Unlock
Step: 3 Unlock