

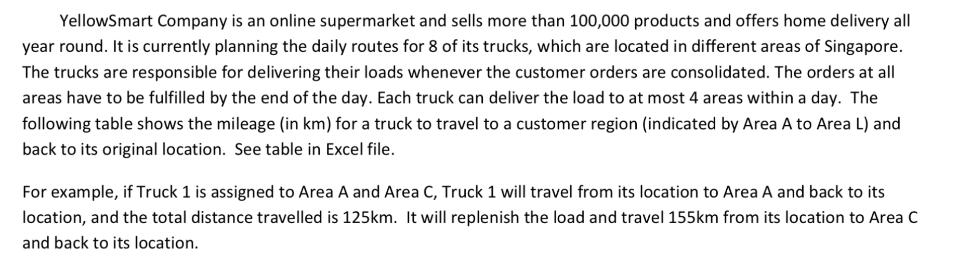
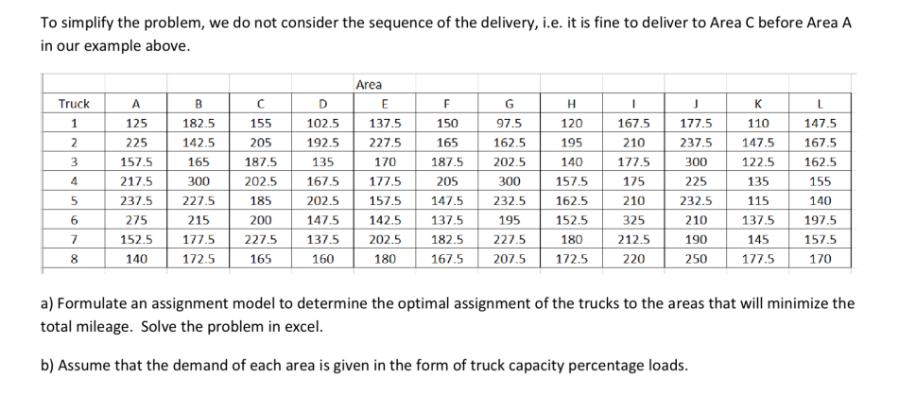
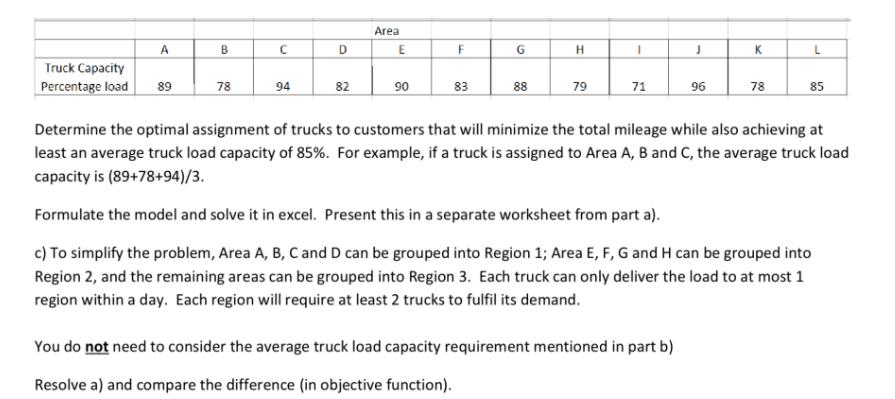
YellowSmart Company is an online supermarket and sells more than 100,000 products and offers home delivery...
Fantastic news! We've Found the answer you've been seeking!
Question:
Expert Answer:
a Assignment model formulation Variables x11 x12 x13x81 1 if truck is assigned to area 0 o... View the full answer

Related Book For 

Business Statistics for Contemporary Decision Making
ISBN: 978-0470910184
6th Edition
Authors: Ken Black
Posted Date:
