

Question: You have just received your progress update for your 13 week project (it is now the end of week 9). Based on the plan, shown
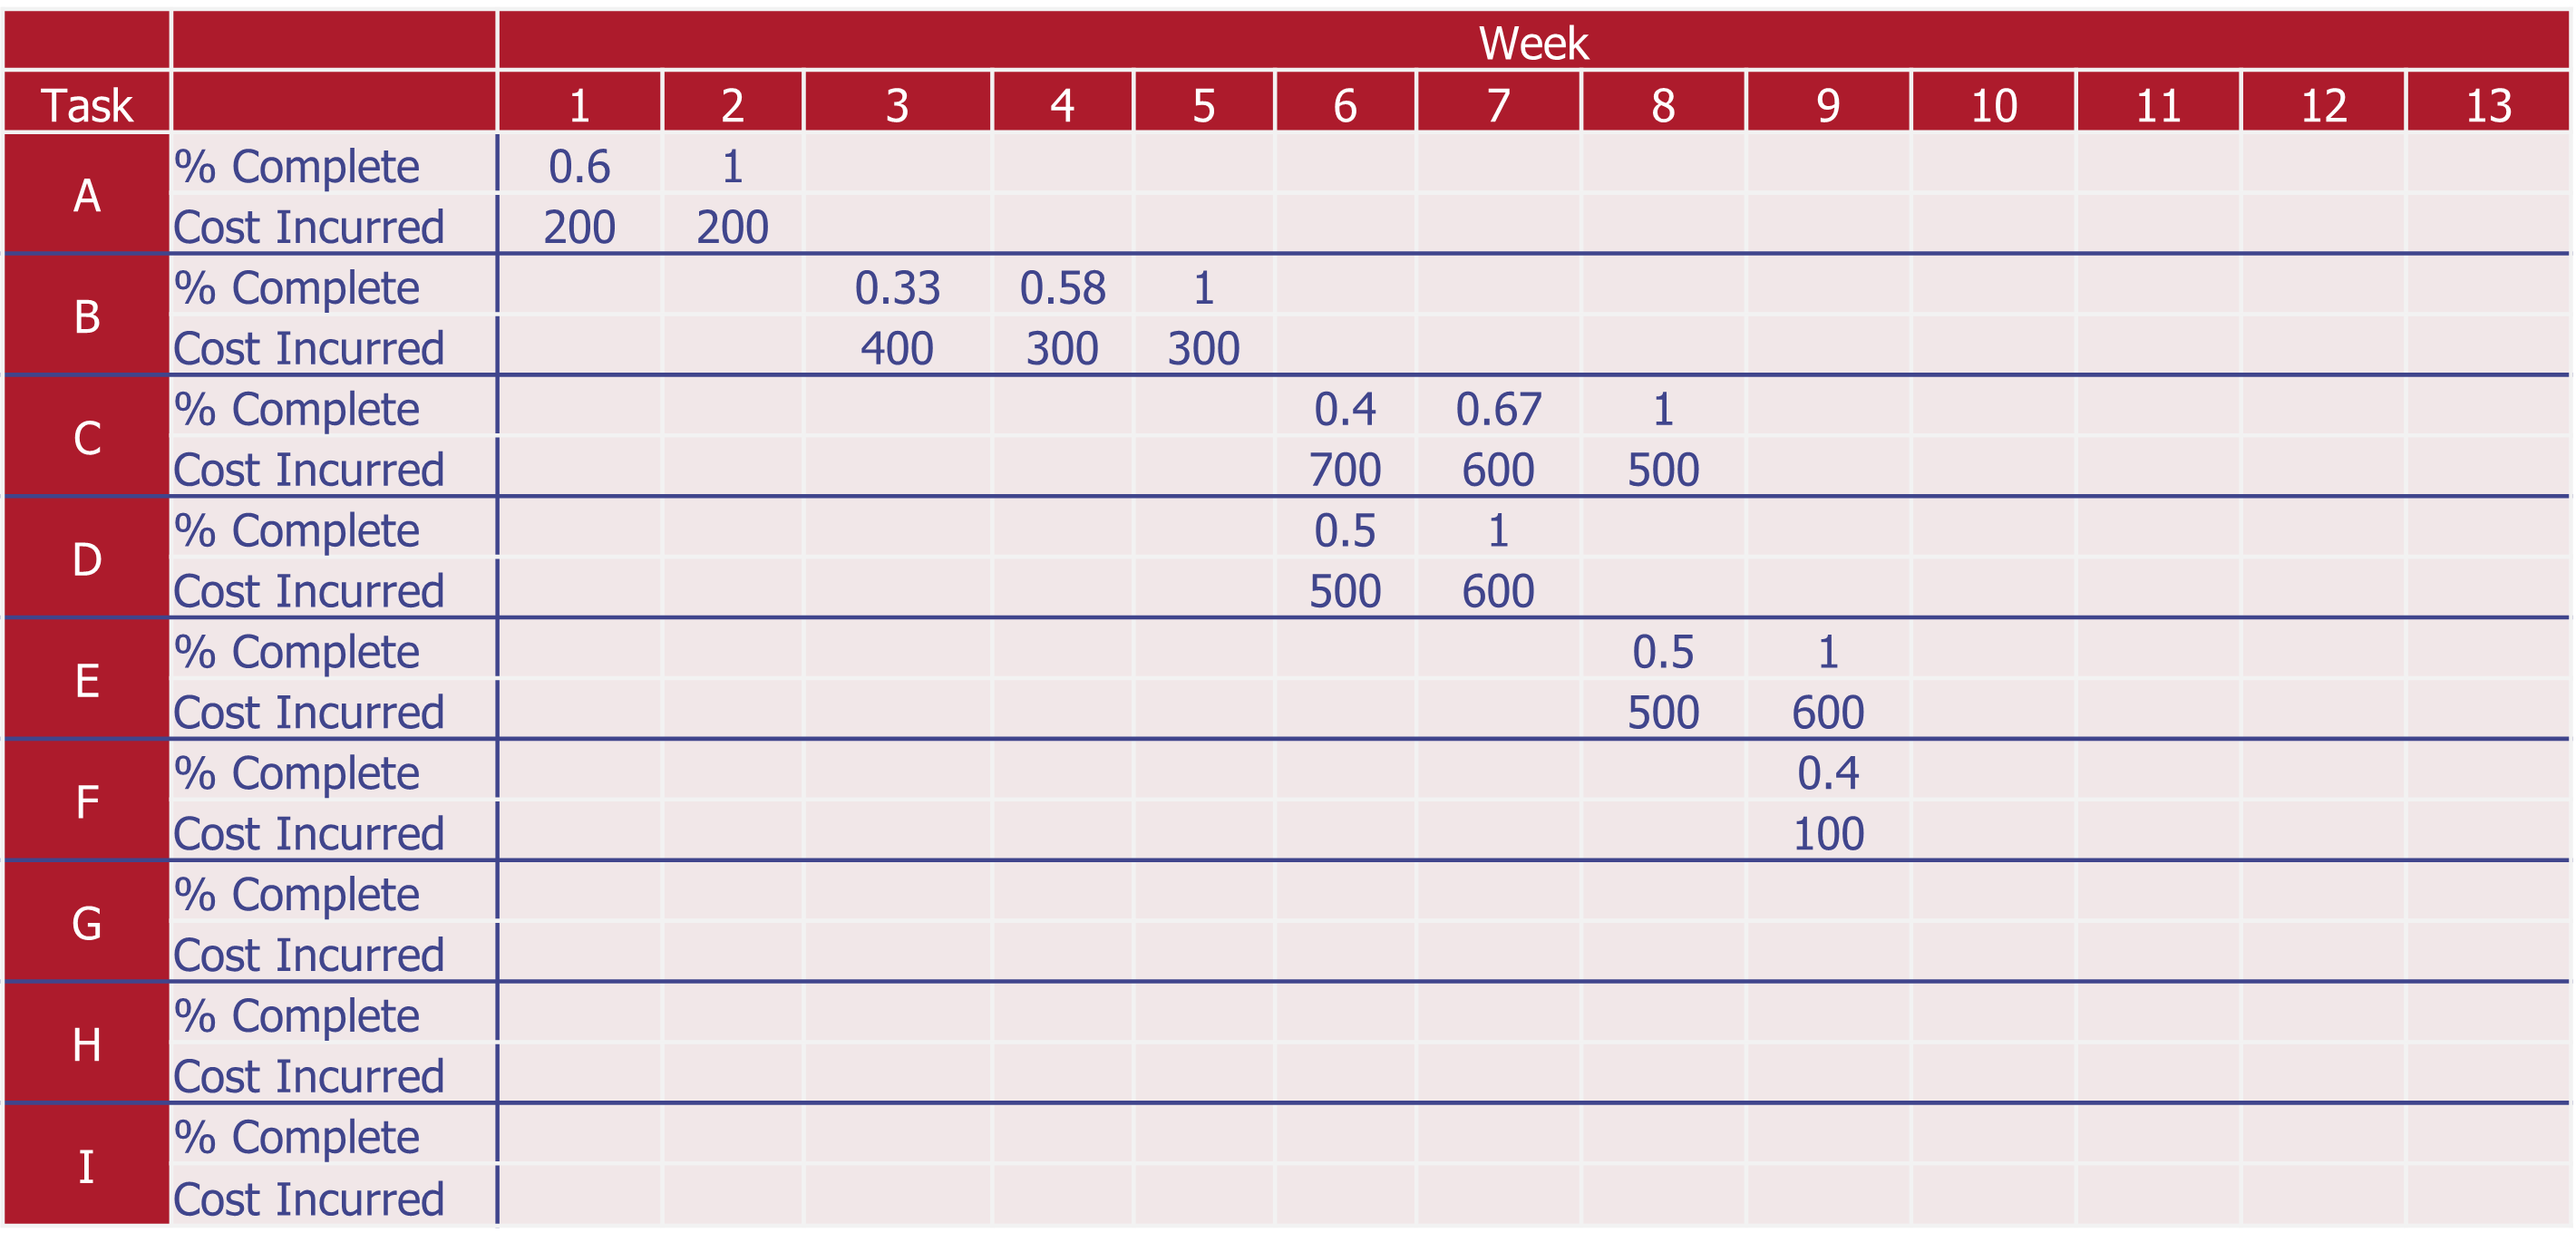
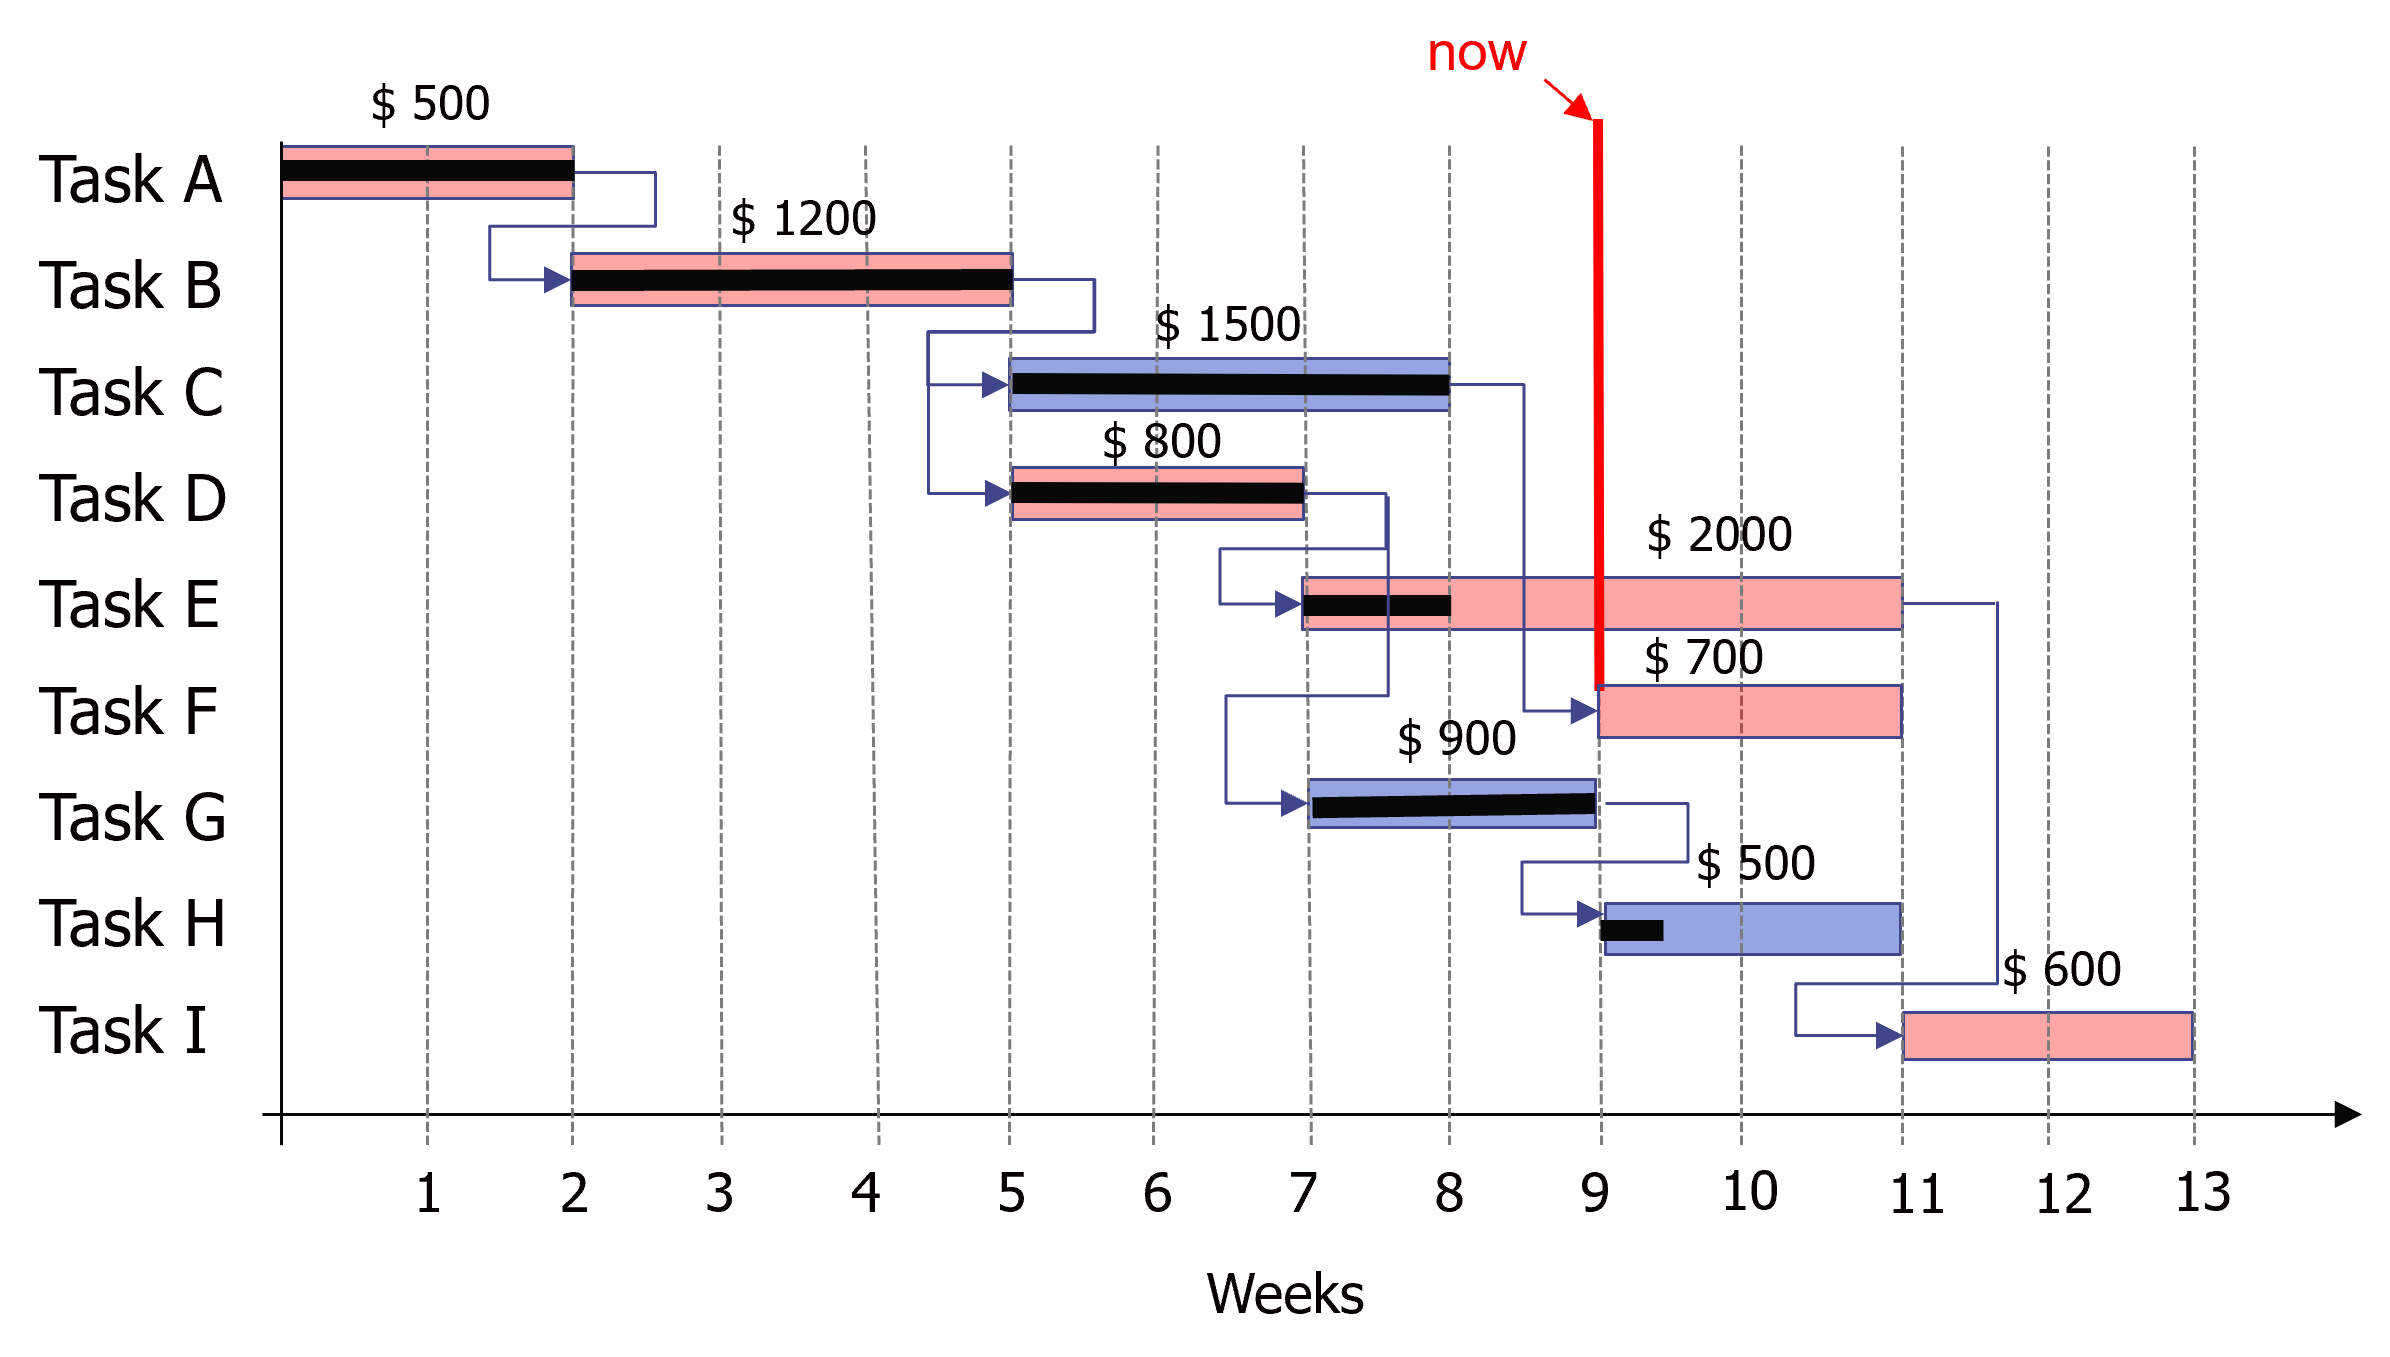
You have just received your progress update for your 13 week project (it is now the end of week 9). Based on the plan, shown in the attached Gantt Chart complete with planned costs, complete an Earned Value Analysis. Using the weekly expenditures and task updates given in the table, create a spreadsheet that calculates your cost and schedule variances and indexes. Plot your indices over the duration of the project. Make a short comment on the performance of your project.
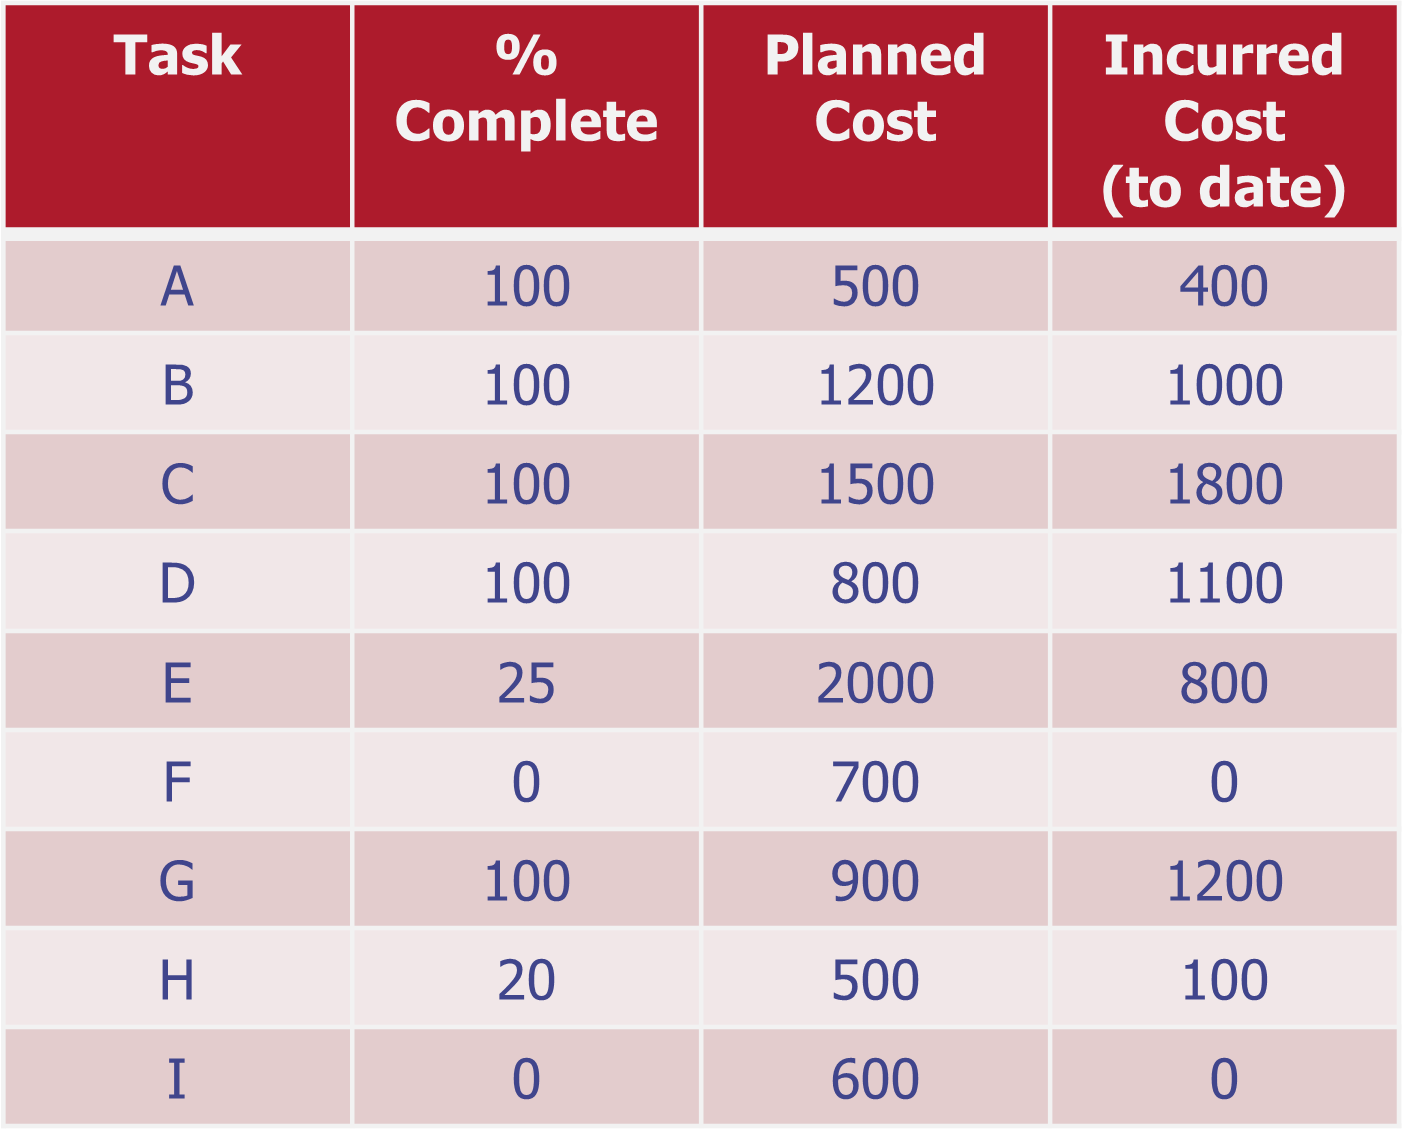
\begin{tabular}{|c|c|c|c|} \hline Task & %Complete & PlannedCost & IncurredCost(todate) \\ \hline A & 100 & 500 & 400 \\ \hline B & 100 & 1200 & 1000 \\ \hline C & 100 & 1500 & 1800 \\ \hline D & 100 & 800 & 1100 \\ \hline E & 25 & 2000 & 800 \\ \hline F & 0 & 700 & 0 \\ \hline G & 100 & 900 & 1200 \\ \hline H & 20 & 500 & 100 \\ \hline I & 0 & 600 & 0 \\ \hline \end{tabular}
Step by Step Solution
There are 3 Steps involved in it

Get step-by-step solutions from verified subject matter experts