

Question: You have just received your progress update for your 13 week project (it is now the end of week 9). Based on the plan, shown
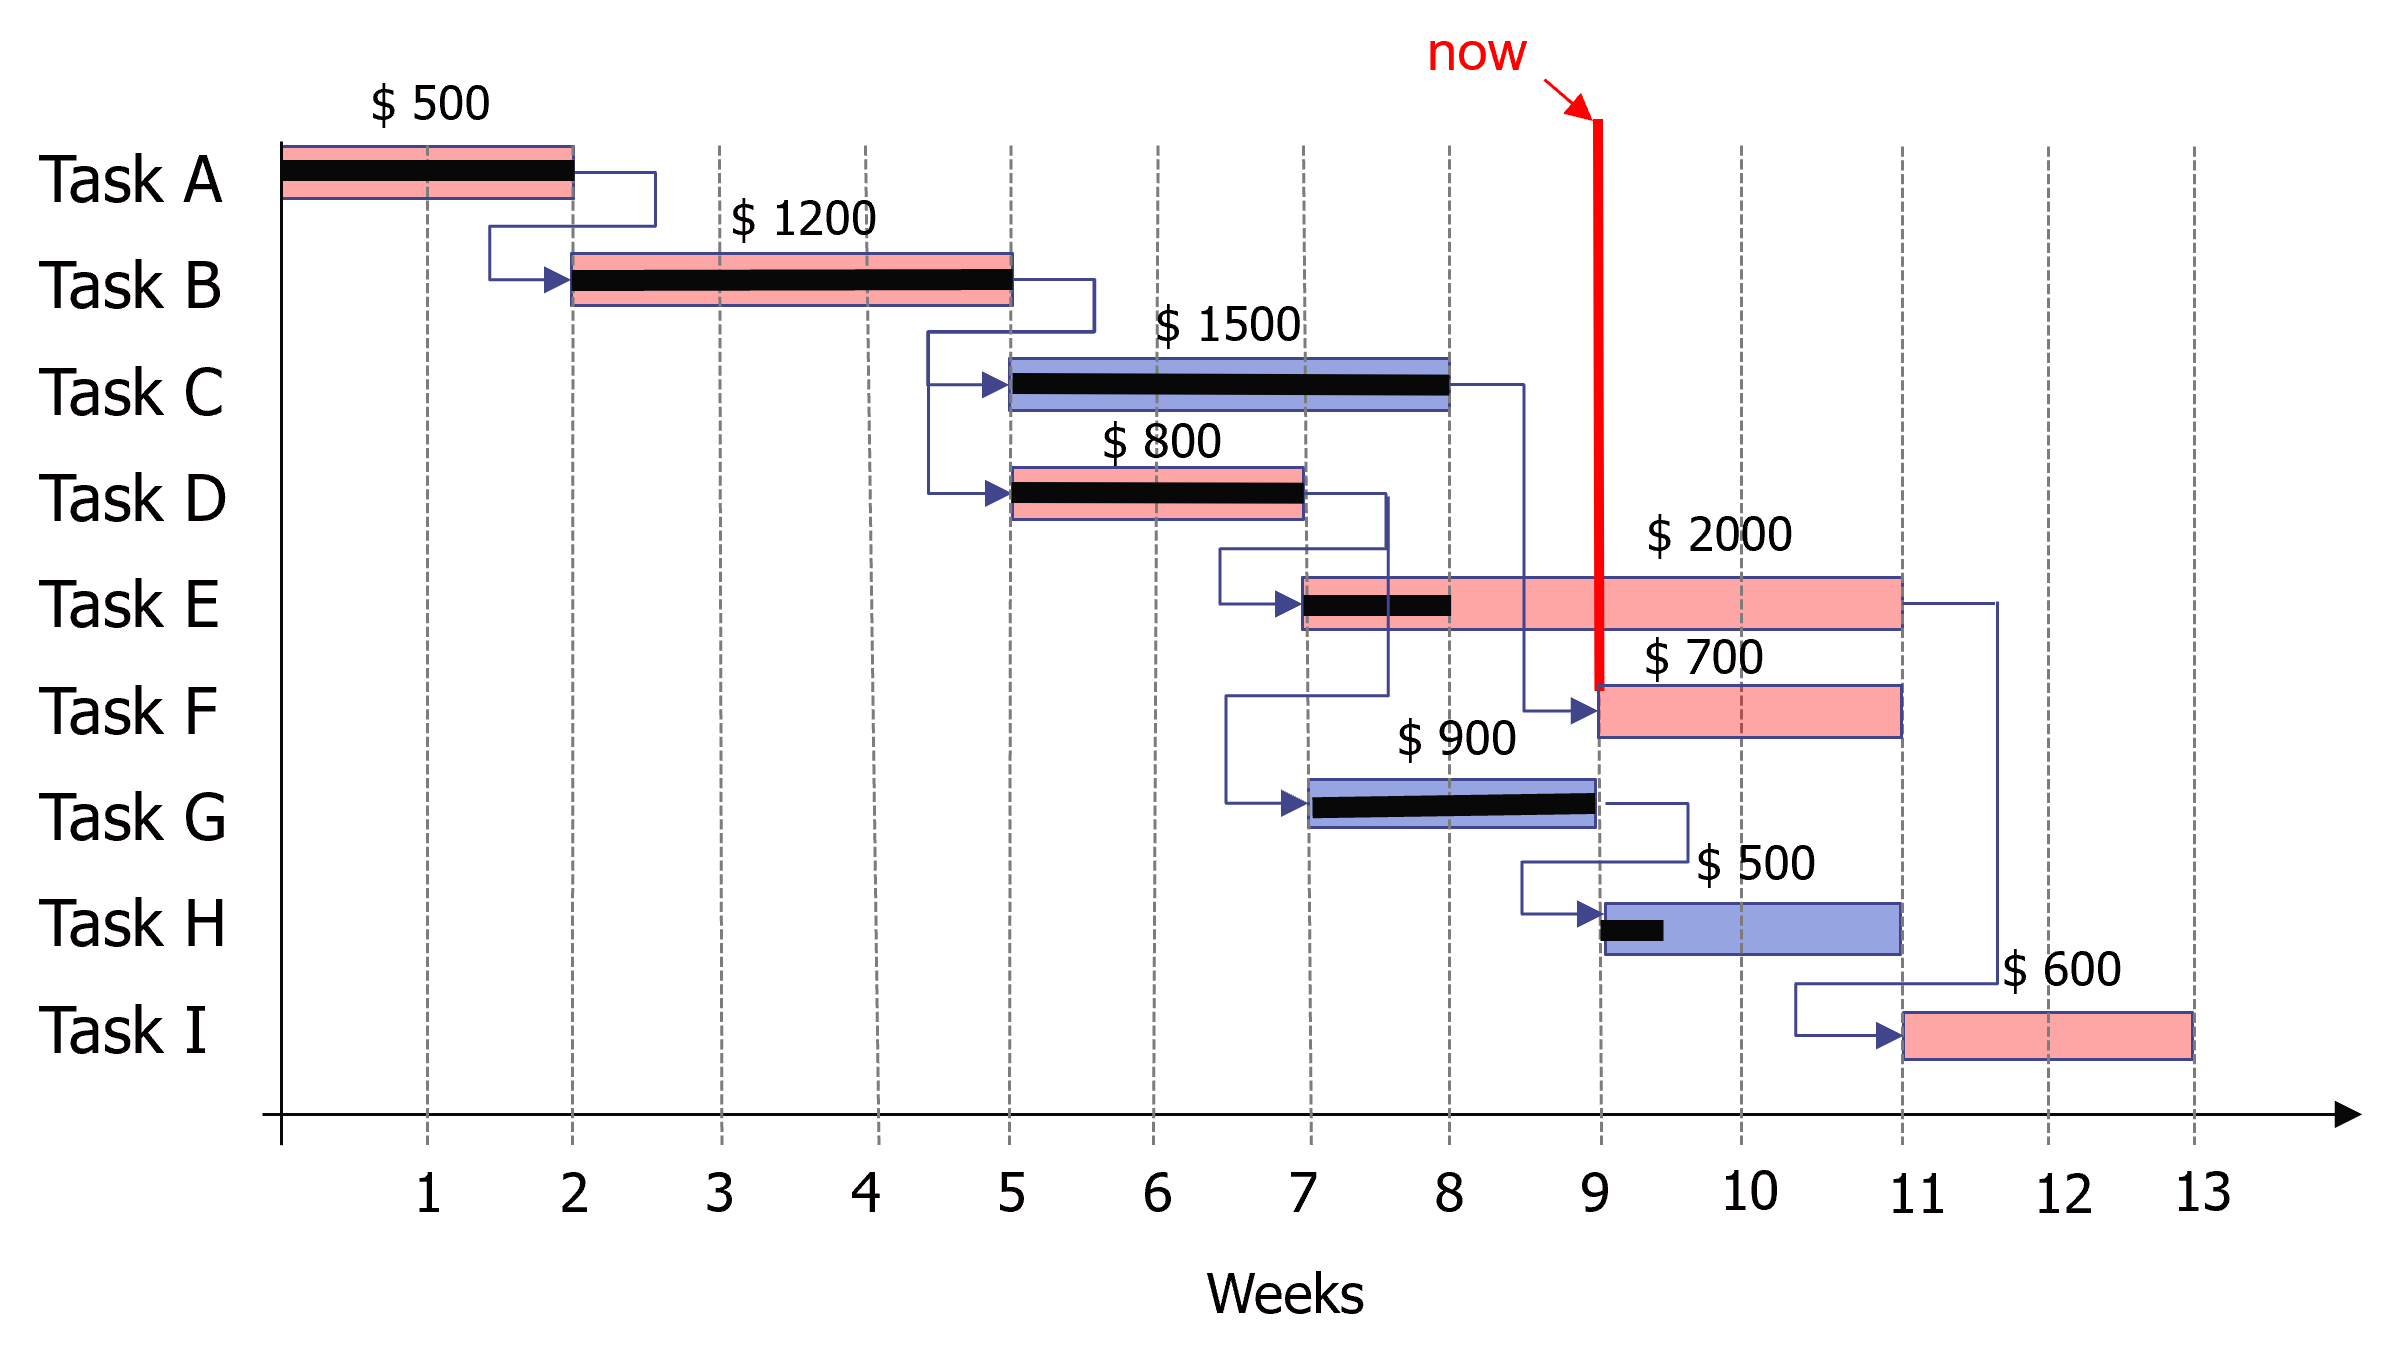
You have just received your progress update for your 13 week project (it is now the end of week 9). Based on the plan, shown in the attached Gantt Chart complete with planned costs,
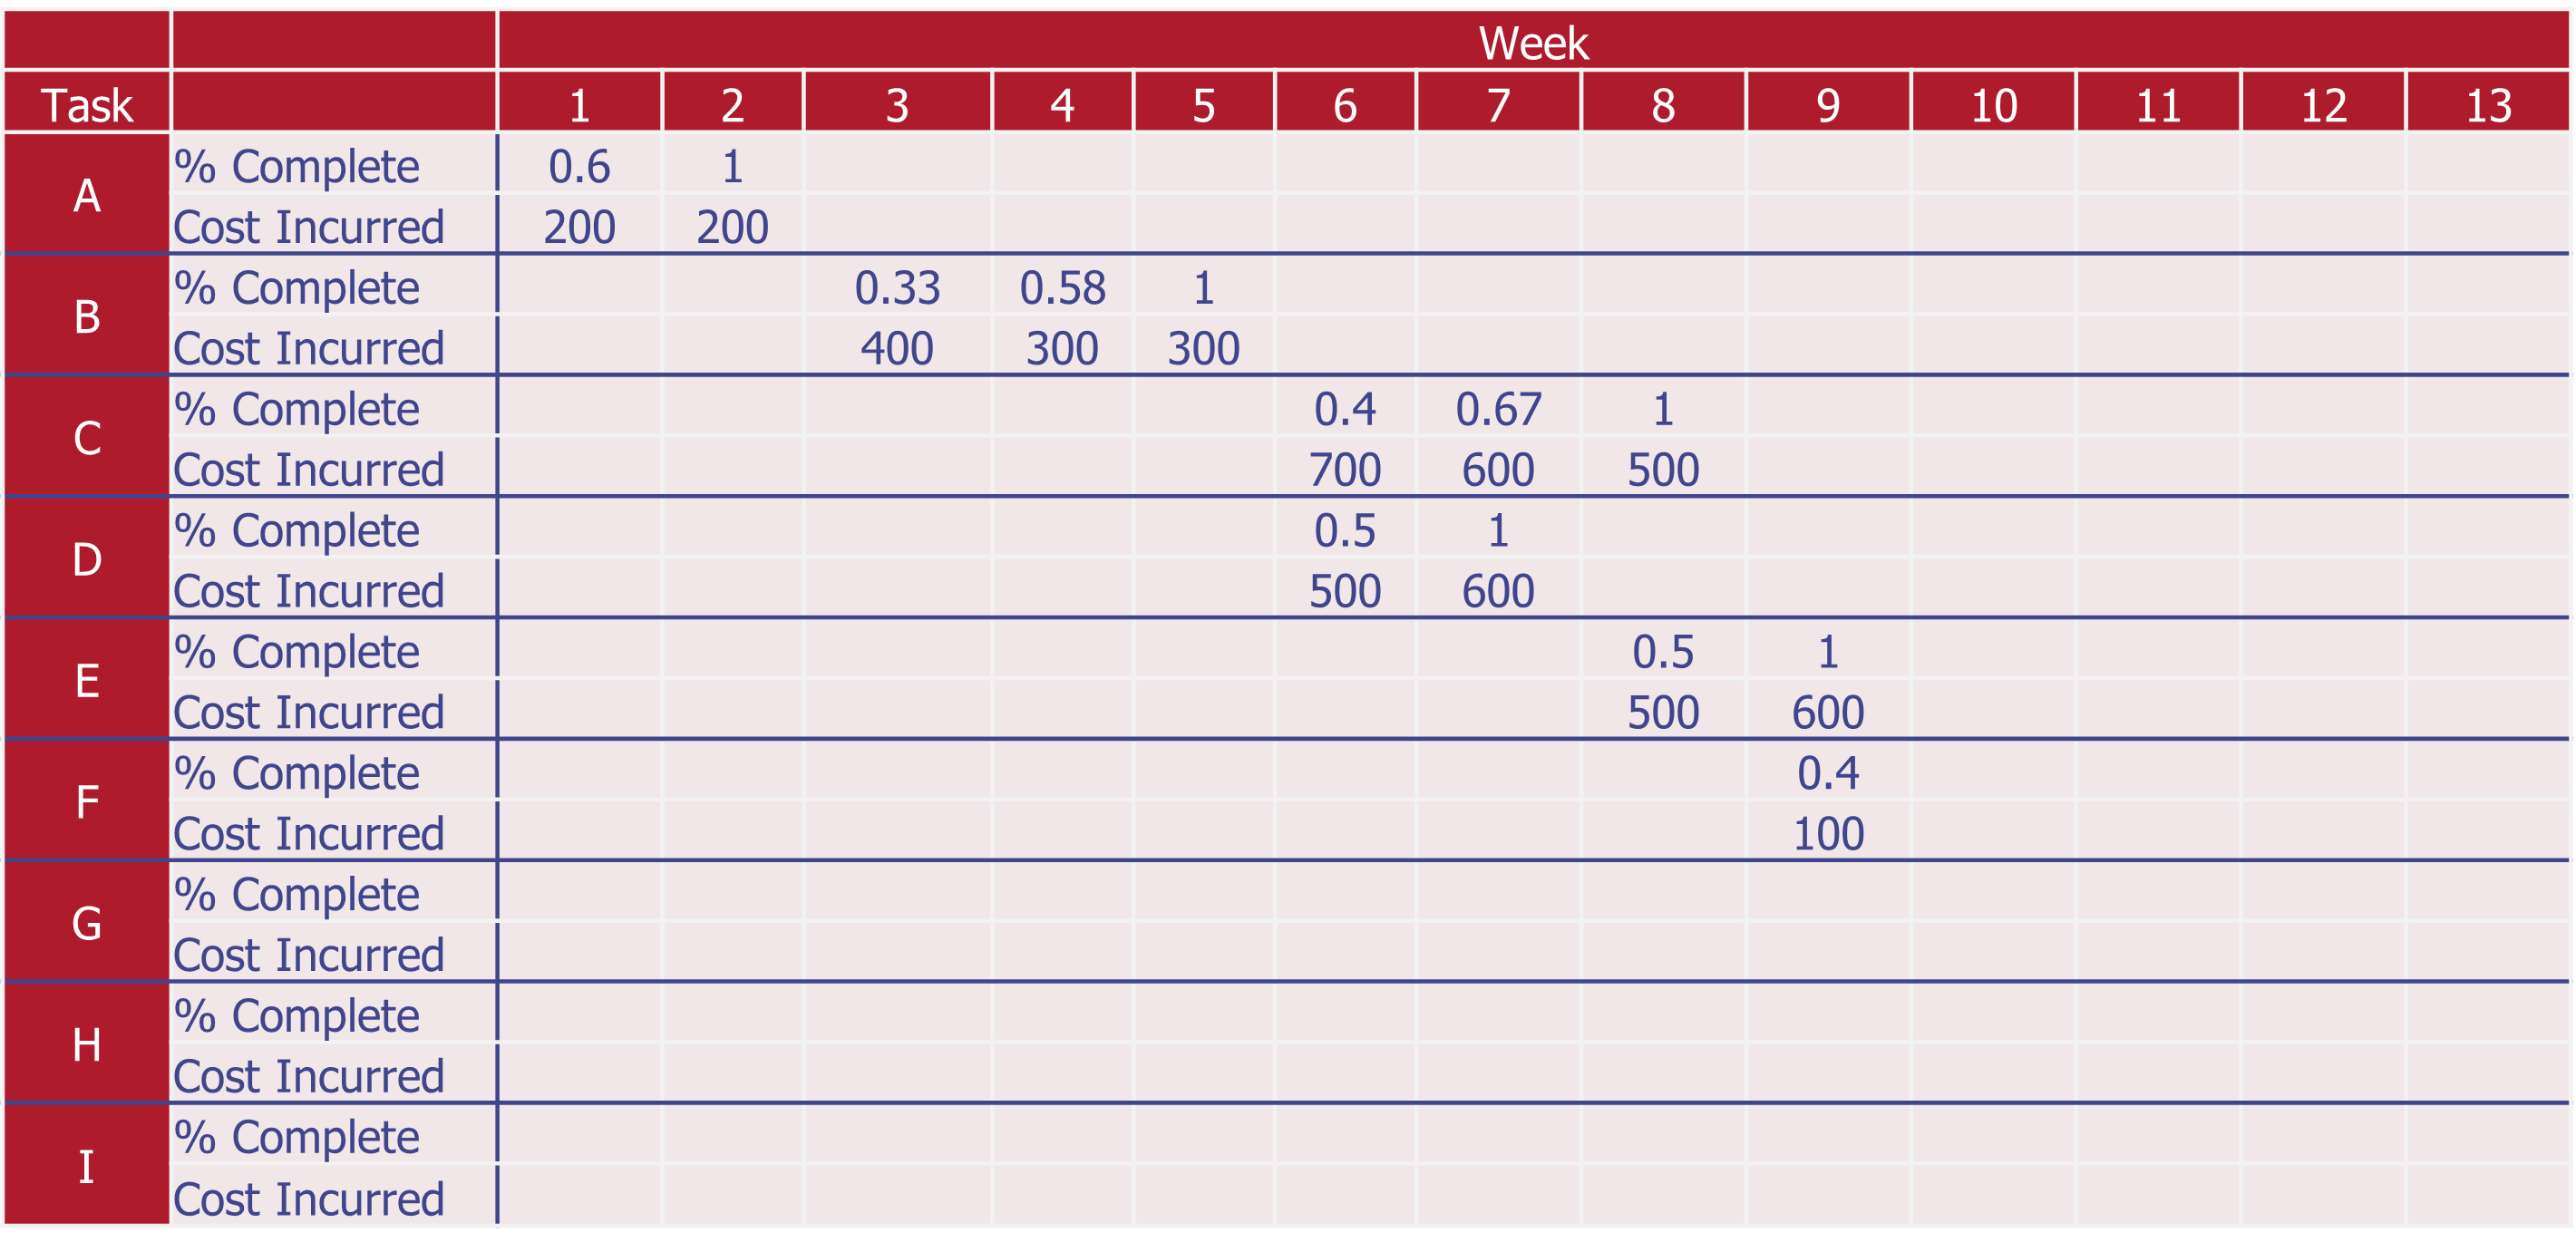
- Plot your indices over the duration of the project.
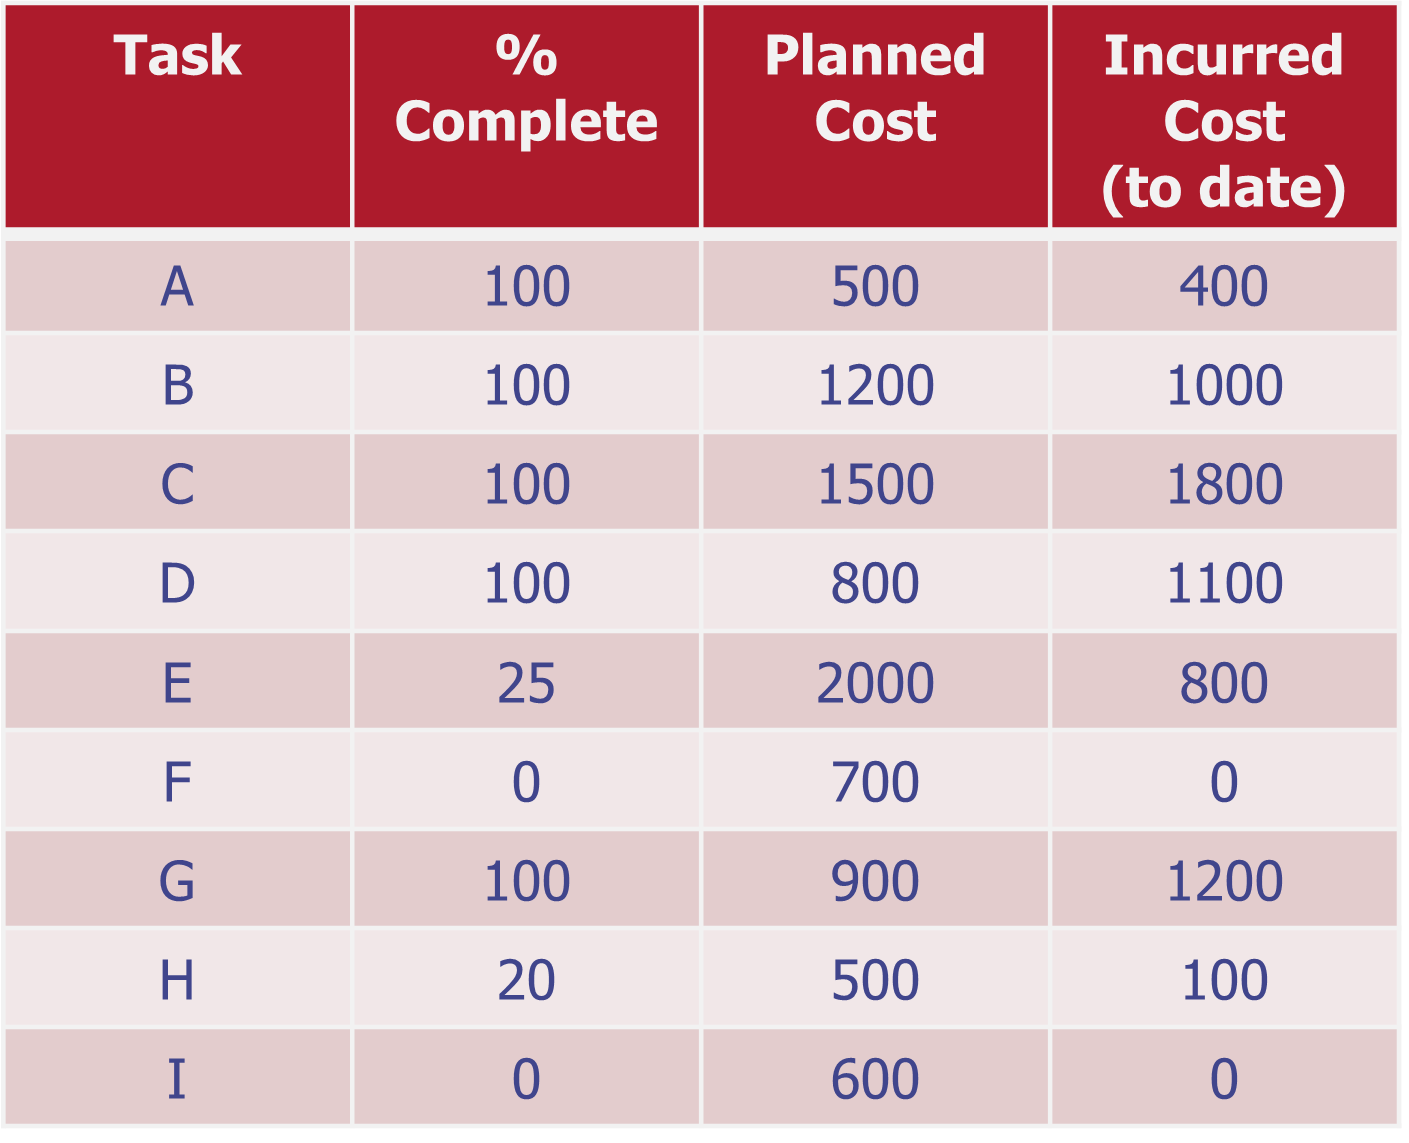
\begin{tabular}{|c|c|c|c|} \hline Task & %Complete & PlannedCost & IncurredCost(todate) \\ \hline A & 100 & 500 & 400 \\ \hline B & 100 & 1200 & 1000 \\ \hline C & 100 & 1500 & 1800 \\ \hline D & 100 & 800 & 1100 \\ \hline E & 25 & 2000 & 800 \\ \hline F & 0 & 700 & 0 \\ \hline G & 100 & 900 & 1200 \\ \hline H & 20 & 500 & 100 \\ \hline I & 0 & 600 & 0 \\ \hline \end{tabular} \begin{tabular}{|c|c|c|c|} \hline Task & %Complete & PlannedCost & IncurredCost(todate) \\ \hline A & 100 & 500 & 400 \\ \hline B & 100 & 1200 & 1000 \\ \hline C & 100 & 1500 & 1800 \\ \hline D & 100 & 800 & 1100 \\ \hline E & 25 & 2000 & 800 \\ \hline F & 0 & 700 & 0 \\ \hline G & 100 & 900 & 1200 \\ \hline H & 20 & 500 & 100 \\ \hline I & 0 & 600 & 0 \\ \hline \end{tabular}
Step by Step Solution
There are 3 Steps involved in it

Get step-by-step solutions from verified subject matter experts