

Question: Analyze the housing price data in Table B. 4 for multicollinearity. Use the variance inflation factors and the condition number of (mathbf{X}^{prime} mathbf{X}). y X1
Analyze the housing price data in Table B. 4 for multicollinearity. Use the variance inflation factors and the condition number of \(\mathbf{X}^{\prime} \mathbf{X}\).
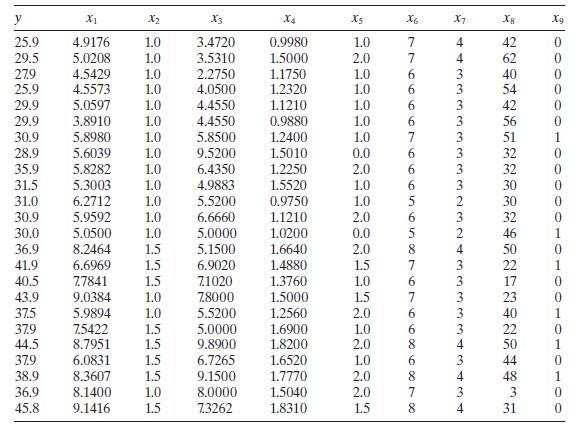
y X1 X2 X3 X4 X5 X6 X7 Xg 25.9 4.9176 1.0 3.4720 0.9980 1.0 29.5 5.0208 1.0 3.5310 1.5000 2.0 27.9 4.5429 1.0 2.2750 1.1750 1.0 25.9 4.5573 1.0 4.0500 1.2320 1.0 6 29.9 5.0597 1.0 4.4550 1.1210 1.0 6 29.9 3.8910 1.0 4.4550 0.9880 1.0 6 30.9 5.8980 1.0 5.8500 1.2400 1.0 7 28.9 5.6039 1.0 9.5200 1.5010 0.0 6 35.9 5.8282 1.0 6.4350 1.2250 2.0 6 31.5 5.3003 1.0 4.9883 1.5520 1.0 6 31.0 6.2712 1.0 5.5200 0.9750 1.0 5 2 30.9 5.9592 1.0 6.6660 1.1210 2.0 6 30.0 5.0500 1.0 5.0000 1.0200 0.0 5 36.9 8.2464 1.5 5.1500 1.6640 2.0 41.9 6.6969 1.5 6.9020 1.4880 1.5 7 40.5 7.7841 1.5 71020 1.3760 1.0 43.9 9.0384 1.0 7.8000 1.5000 1.5 7 37.5 5.9894 1.0 5.5200 1.2560 2.0 37.9 7.5422 1.5 5.0000 1.6900 1.0 44.5 8.7951 1.5 9.8900 1.8200 2.0 37.9 6.0831 1.5 6.7265 1.6520 1.0 38.9 8.3607 1.5 9.1500 1.7770 2.0 8 36.9 8.1400 1.0 8.0000 1.5040 2.0 7 45.8 9.1416 1.5 7.3262 1.8310 1.5 8 716 4433 mm mm3323243 m m m4343 +4 65876266 6 42 0 62 0 40 0 54 0 3 42 0 3 56 0 51 1 32 0 32 0 30 0 30 0 32 0 46 1 50 0 22 1 3 17 0 3 23 0 3 40 1 3 22 0 50 44 0 48 3 0 31 0
Step by Step Solution
3.46 Rating (153 Votes )
There are 3 Steps involved in it

Get step-by-step solutions from verified subject matter experts