

Question: Use stepwise regression with (F_{mathrm{IN}}=F_{text {OUT }}=4.0) to find the best set of regressor variables for the Belle Ayr liquefaction data in Table B.5. Repeat
Use stepwise regression with \(F_{\mathrm{IN}}=F_{\text {OUT }}=4.0\) to find the "best" set of regressor variables for the Belle Ayr liquefaction data in Table B.5. Repeat the analysis with \(F_{\mathrm{IN}}=F_{\mathrm{OUT}}=2.0\). Are there any substantial differences in the models obtained?
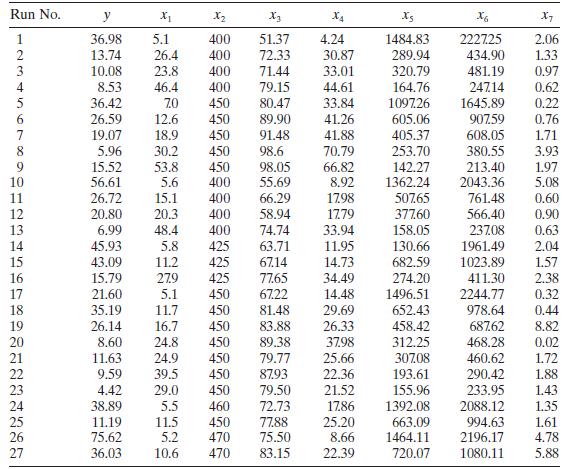
Run No. y x1 X2 X4 X6 X7 1 36.98 5.1 400 51.37 4.24 1484.83 222725 2.06 123456789DUNEN222222 13.74 26.4 400 72.33 30.87 289.94 434.90 1.33 10.08 23.8 400 71.44 33.01 320.79 481.19 0.97 8.53 46.4 400 79.15 44.61 164.76 247.14 0.62 36.42 7.0 450 80.47 33.84 1097.26 1645.89 0.22 26.59 12.6 450 89.90 41.26 605.06 907.59 0.76 19.07 18.9 450 91.48 41.88 405.37 608.05 1.71 5.96 30.2 450 98.6 70.79 253.70 380.55 3.93 15.52 53.8 450 98.05 66.82 142.27 213.40 1.97 10 56.61 5.6 400 55.69 8.92 1362.24 2043.36 5.08 11 26.72 15.1 400 66.29 17.98 507.65 761.48 0.60 20.80 20.3 400 58.94 17.79 377.60 566.40 0.90 6.99 48.4 400 74.74 33.94 158.05 237.08 0.63 45.93 5.8 425 63.71 11.95 130.66 1961.49 2.04 43.09 11.2 425 67.14 14.73 682.59 1023.89 1.57 15.79 27.9 425 77.65 34.49 274.20 411.30 2.38 21.60 5.1 450 67.22 14.48 1496.51 2244.77 0.32 35.19 11.7 450 81.48 29.69 652.43 978.64 0.44 26.14 16.7 450 83.88 26.33 458.42 687.62 8.82 20 8.60 24.8 450 89.38 37.98 312.25 468.28 0.02 11.63 24.9 450 79.77 25.66 30708 460.62 1.72 9.59 39.5 450 87.93 22.36 193.61 290.42 1.88 4.42 29.0 450 79.50 21.52 155.96 233.95 1.43 38.89 5.5 460 72.73 17.86 1392.08 2088.12 1.35 11.19 11.5 450 77.88 25.20 663.09 994.63 1.61 75.62 5.2 470 75.50 8.66 1464.11 2196.17 4.78 36.03 10.6 470 83.15 22.39 720.07 1080.11 5.88
Step by Step Solution
3.36 Rating (162 Votes )
There are 3 Steps involved in it

Get step-by-step solutions from verified subject matter experts