

Question: Consider the advertising data given in Problem 2.18. Problem 2.18 Consider the fuel consumption data in Table B.18. For the purposes of this exercise, ignore
Consider the advertising data given in Problem 2.18.
Problem 2.18
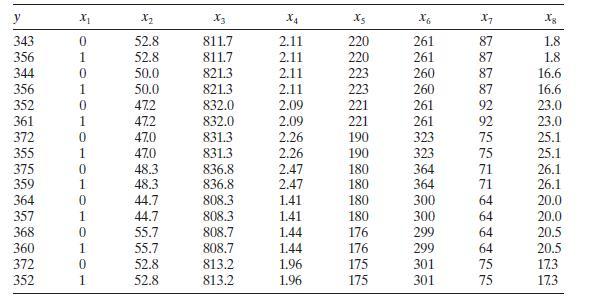
Consider the fuel consumption data in Table B.18. For the purposes of this exercise, ignore regressor $x_{1}$. Perform a thorough analysis of these data. What conclusions do you draw from this analysis?
a. Construct a normal probability plot of the residuals from the full model. Does there seem to be any problem with the normality assumption?
b. Construct and interpret a plot of the residuals versus the predicted response.
y X2 X3 X4 X5 X6 X7 Xg 343 0 52.8 811.7 2.11 220 261 87 1.8 356 1 52.8 811.7 2.11 220 261 87 1.8 344 0 50.0 821.3 2.11 223 260 87 16.6 356 1 50.0 821.3 2.11 223 260 87 16.6 352 0 47.2 832.0 2.09 221 261 92 23.0 361 1 47.2 832.0 2.09 221 261 92 23.0 372 0 47.0 831.3 2.26 190 323 75 25.1 355 1 47.0 831.3 2.26 190 323 75 25.1 375 0 48.3 836.8 2.47 180 364 71 26.1 359 1 48.3 836.8 2.47 180 364 71 26.1 364 0 44.7 808.3 1.41 180 300 64 20.0 357 1 44.7 808.3 1.41 180 300 64 20.0 368 0 55.7 808.7 1.44 176 299 64 20.5 360 1 55.7 808.7 1.44 176 299 372 0 52.8 813.2 1.96 175 301 352 1 52.8 813.2 1.96 175 301 4 75 75 64 20.5 17.3 173
Step by Step Solution
There are 3 Steps involved in it

Get step-by-step solutions from verified subject matter experts