

Question: In Problem 3.14, you were asked to fit a model to the kinematic viscosity data in Table B. 10. Problem 3.14 The kinematic viscosity of
In Problem 3.14, you were asked to fit a model to the kinematic viscosity data in Table B. 10.
Problem 3.14
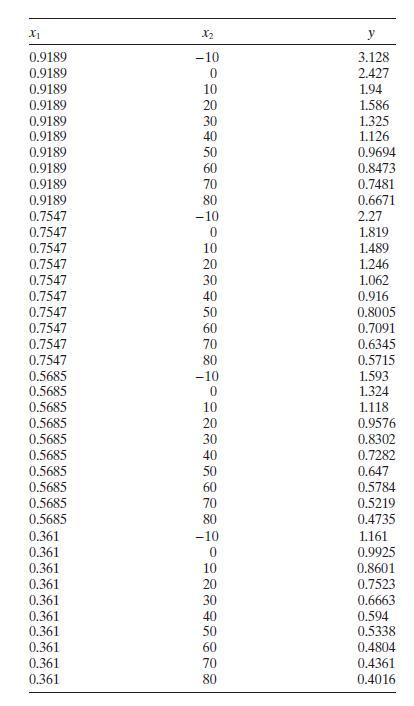
The kinematic viscosity of a certain solvent system depends on the ratio of the two solvents and the temperature. Table B. 10 summarizes a set of experimental results.
a. Construct a normality plot of the residuals from the full model. Does there seem to be any problem with the normality assumption?
b. Construct and interpret a plot of the residuals versus the predicted response.
c. In Problem 3.14, you were asked to fit a second model. Compute the PRESS statistic for both models. Based on this statistic, which model is most likely to provide better predictions of new data?
x2 y 0.9189 -10 0.9189 0 3.128 2.427 0.9189 10 1.94 0.9189 20 1.586 0.9189 30 1.325 0.9189 40 1.126 0.9189 50 0.9694 0.9189 60 0.8473 0.9189 70 0.7481 0.9189 80 0.6671 0.7547 -10 2.27 0.7547 0 1.819 0.7547 10 1.489 0.7547 20 1.246 0.7547 30 1.062 0.7547 40 0.916 0.7547 50 0.8005 0.7547 60 0.7091 0.7547 70 0.6345 0.7547 80 0.5715 0.5685 -10 1.593 0.5685 0 1.324 0.5685 10 1.118 0.5685 20 0.9576 0.5685 30 0.8302 0.5685 0.7282 0.5685 0.647 0.5685 0.5784 0.5685 0.5219 0.5685 0.4735 0.361 -10 1.161 0.361 0 0.9925 0.361 10 0.8601 0.361 20 0.7523 0.361 30 0.6663 0.361 0.594 0.361 50 0.5338 0.361 60 0.4804 0.361 70 0.4361 0.361 80 0.4016
Step by Step Solution
There are 3 Steps involved in it

Get step-by-step solutions from verified subject matter experts