

Question: Consider the global mean surface temperature and (mathrm{CO}_{2}) concentration from Table B.17. Fit the lagged variables regression models in Eqs. (14.26) and (14.27) to these
Consider the global mean surface temperature and \(\mathrm{CO}_{2}\) concentration from Table B.17. Fit the lagged variables regression models in Eqs. (14.26) and (14.27) to these data. Compare these models to the results that you obtained in Exercise 14.1. Do the residuals from these models give any indication of remaining problems with autocorrelation?
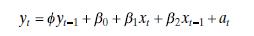
Equation 14.26
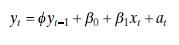
Equation 14.27
Exercise 14.1
Table B. 17 contains data on the global mean surface air temperature anomaly and the global CO2 concentration. Fit a regression model to these data, using the global CO2 concentration as the predictor. Analyze the residuals from this model. Is there evidence of autocorrelation in these data? If so, use one iteration of the Cochrane-Orcutt method to estimate the parameters.
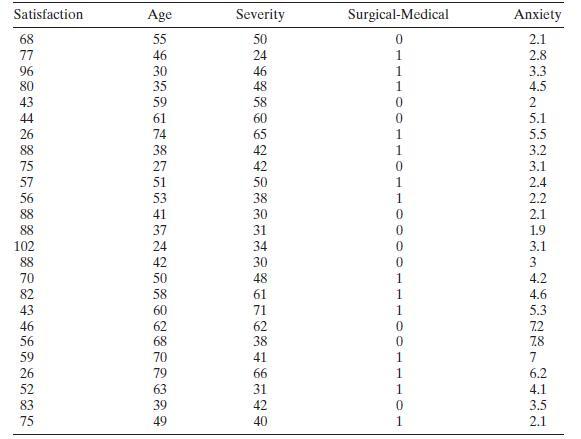
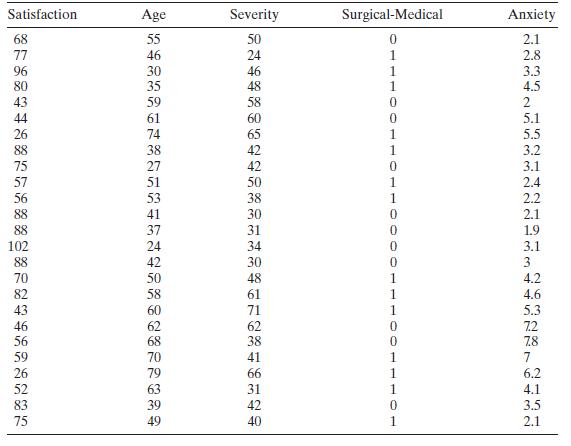
Satisfaction. Age Severity Surgical-Medical Anxiety 60 65 0 0 ECERTENCERECERRERCENCE
Step by Step Solution
3.42 Rating (155 Votes )
There are 3 Steps involved in it

Get step-by-step solutions from verified subject matter experts