

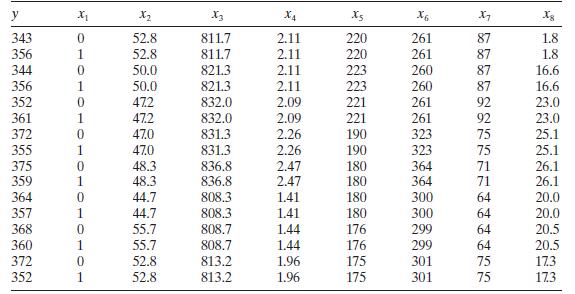
Question: Consider the chemical process data in Table B.18. Fit the lagged variables regression models in Eqs. (14.26) and (14.27) to the yield response using temperature
Consider the chemical process data in Table B.18. Fit the lagged variables regression models in Eqs. (14.26) and (14.27) to the yield response using temperature as the predictor. Compare these models to the results that you obtained in Exercise 14.2. Do the residuals from these models give any indication of remaining problems with autocorrelation?.
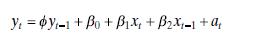
Equation (14.26)
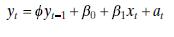
Equation (14.27)
Data From Exercise 14.2
Table B. 18 contains hourly yield measurements from a chemical process and the process operating temperature. Fit a regression model to these data with the Cochrane-Orcutt method, using the temperature as the predictor. Analyze the residuals from this model. Is there evidence of autocorrelation in these data?
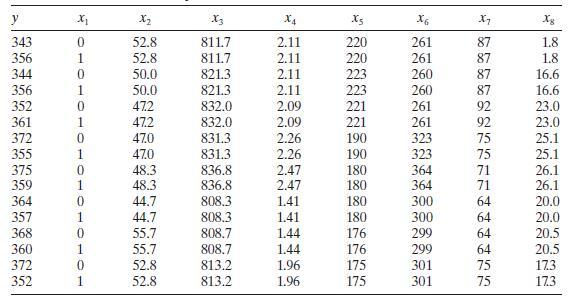
y X2 X3 X4 X6 x7 8 343 52.8 811.7 2.11 220 261 87 1.8 356 1 52.8 811.7 2.11 220 261 87 1.8 344 0 50.0 821.3 2.11 223 260 16.6 356 50.0 821.3 2.11 223 260 16.6 352 472 832.0 2.09 221 261 92 23.0 361 47.2 832.0 2.09 221 261 92 23.0 372 47.0 831.3 2.26 190 323 75 25.1 355 47.0 831.3 2.26 190 323 75 25.1 375 48.3 836.8 2.47 180 364 71 26.1 359 48.3 836.8 2.47 180 364 71 26.1 364 44.7 808.3 1.41 180 300 64 20.0 357 44.7 808.3 1.41 180 300 64 20.0 368 55.7 808.7 1.44 176 299 64 20.5 360 55.7 808.7 1.44 176 299 64 20.5 372 0 52.8 813.2 1.96 175 301 75 173 352 1 52.8 813.2 1.96 175 301 75 173
Step by Step Solution
There are 3 Steps involved in it

Get step-by-step solutions from verified subject matter experts