

Question: Consider the methanol oxidation data in Table B.20. Perform a thorough analysis of these data. What conclusions do you draw from this residual analysis? x
Consider the methanol oxidation data in Table B.20. Perform a thorough analysis of these data. What conclusions do you draw from this residual analysis?
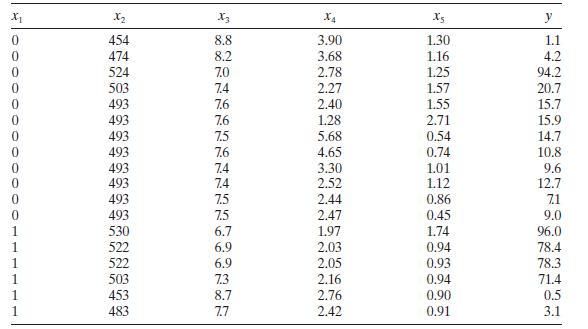
x x2 X3 X4 0 454 8.8 3.90 1.30 1.1 0 474 8.2 3.68 1.16 4.2 0 524 7.0 2.78 1.25 94.2 0 503 7.4 2.27 1.57 20.7 0 493 7.6 2.40 1.55 15.7 0 493 7.6 1.28 2.71 15.9 0 493 7.5 5.68 0.54 14.7 0 493 7.6 4.65 0.74 10.8 0 493 7.4 3.30 1.01 9.6 0 493 7.4 2.52 1.12 12.7 0 493 7.5 2.44 0.86 7.1 493 7.5 2.47 0.45 9.0 530 6.7 1.97 1.74 96.0 522 6.9 2.03 0.94 78.4 522 6.9 2.05 0.93 78.3 503 7.3 2.16 0.94 71.4 453 8.7 2.76 0.90 0.5 483 7.7 2.42 0.91 3.1
Step by Step Solution
3.34 Rating (151 Votes )
There are 3 Steps involved in it
Residual Analysis The residuals range from 1748 to 2018 indicating some variability around the ... View full answer

Get step-by-step solutions from verified subject matter experts